Filipino vs Choctaw Births to Unmarried Women
COMPARE
Filipino
Choctaw
Births to Unmarried Women
Births to Unmarried Women Comparison
Filipinos
Choctaw
23.0%
BIRTHS TO UNMARRIED WOMEN
100.0/ 100
METRIC RATING
3rd/ 347
METRIC RANK
36.9%
BIRTHS TO UNMARRIED WOMEN
0.1/ 100
METRIC RATING
272nd/ 347
METRIC RANK
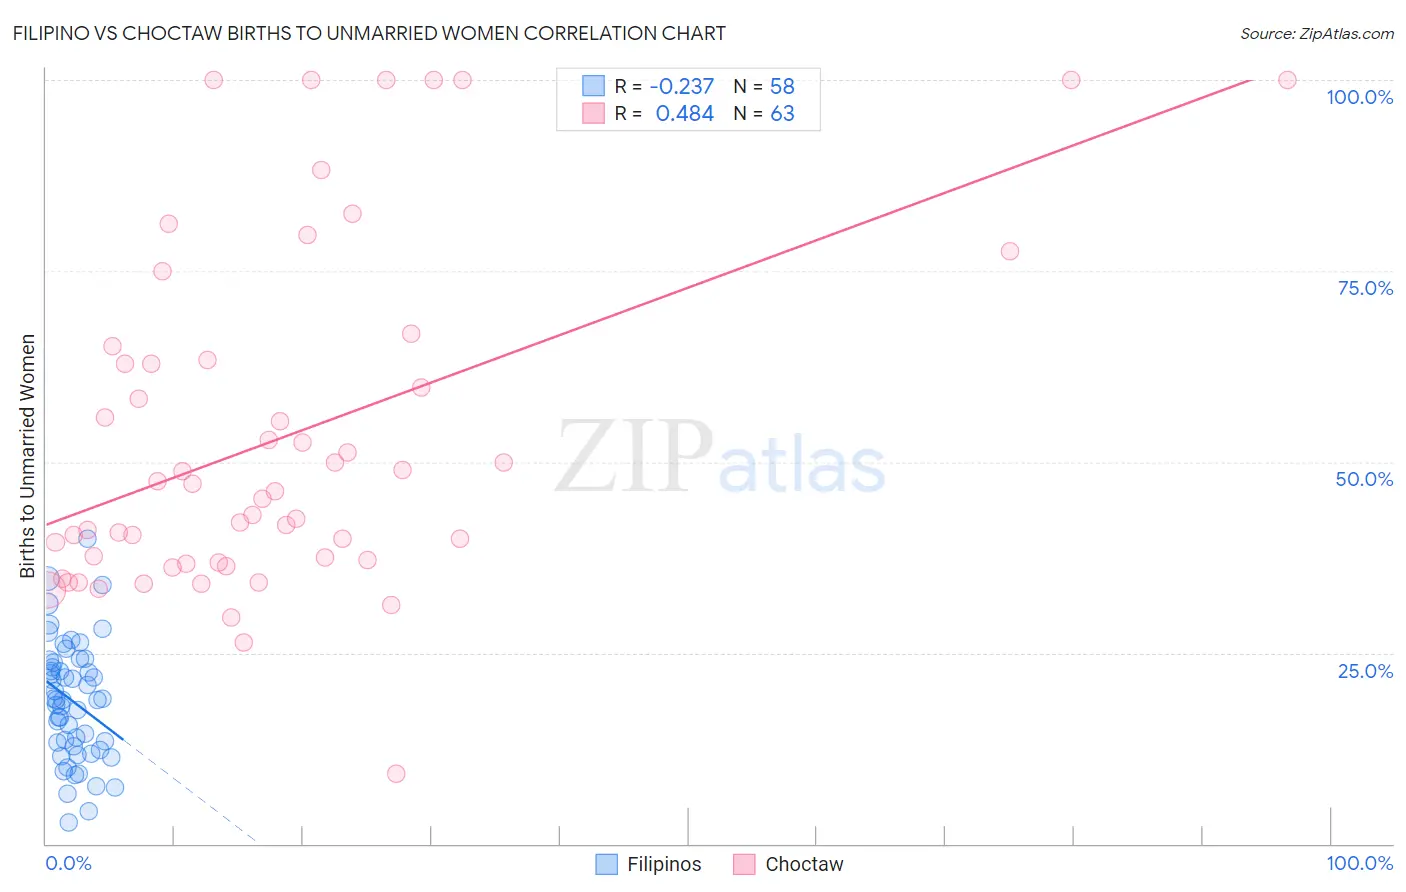
Filipino vs Choctaw Births to Unmarried Women Correlation Chart
The statistical analysis conducted on geographies consisting of 239,363,717 people shows a weak negative correlation between the proportion of Filipinos and percentage of births to unmarried women in the United States with a correlation coefficient (R) of -0.237 and weighted average of 23.0%. Similarly, the statistical analysis conducted on geographies consisting of 258,635,203 people shows a moderate positive correlation between the proportion of Choctaw and percentage of births to unmarried women in the United States with a correlation coefficient (R) of 0.484 and weighted average of 36.9%, a difference of 60.5%.
Births to Unmarried Women Correlation Summary
| Measurement | Filipino | Choctaw |
| Minimum | 2.8% | 9.1% |
| Maximum | 40.0% | 100.0% |
| Range | 37.2% | 90.9% |
| Mean | 18.7% | 53.2% |
| Median | 18.9% | 46.2% |
| Interquartile 25% (IQ1) | 12.7% | 36.9% |
| Interquartile 75% (IQ3) | 23.7% | 63.4% |
| Interquartile Range (IQR) | 11.0% | 26.5% |
| Standard Deviation (Sample) | 7.8% | 22.4% |
| Standard Deviation (Population) | 7.7% | 22.2% |
Similar Demographics by Births to Unmarried Women
Demographics Similar to Filipinos by Births to Unmarried Women
In terms of births to unmarried women, the demographic groups most similar to Filipinos are Immigrants from Taiwan (23.0%, a difference of 0.14%), Immigrants from India (22.9%, a difference of 0.38%), Immigrants from Hong Kong (23.6%, a difference of 2.6%), Immigrants from Iran (24.0%, a difference of 4.3%), and Thai (24.0%, a difference of 4.6%).
| Demographics | Rating | Rank | Births to Unmarried Women |
| Assyrians/Chaldeans/Syriacs | 100.0 /100 | #1 | Exceptional 22.0% |
| Immigrants | India | 100.0 /100 | #2 | Exceptional 22.9% |
| Filipinos | 100.0 /100 | #3 | Exceptional 23.0% |
| Immigrants | Taiwan | 100.0 /100 | #4 | Exceptional 23.0% |
| Immigrants | Hong Kong | 100.0 /100 | #5 | Exceptional 23.6% |
| Immigrants | Iran | 100.0 /100 | #6 | Exceptional 24.0% |
| Thais | 100.0 /100 | #7 | Exceptional 24.0% |
| Immigrants | China | 100.0 /100 | #8 | Exceptional 24.7% |
| Immigrants | South Central Asia | 100.0 /100 | #9 | Exceptional 24.7% |
| Immigrants | Eastern Asia | 100.0 /100 | #10 | Exceptional 25.0% |
| Immigrants | Israel | 100.0 /100 | #11 | Exceptional 25.1% |
| Indians (Asian) | 100.0 /100 | #12 | Exceptional 25.3% |
| Iranians | 100.0 /100 | #13 | Exceptional 25.3% |
| Immigrants | Lebanon | 100.0 /100 | #14 | Exceptional 25.3% |
| Immigrants | Singapore | 100.0 /100 | #15 | Exceptional 25.6% |
Demographics Similar to Choctaw by Births to Unmarried Women
In terms of births to unmarried women, the demographic groups most similar to Choctaw are Mexican (36.9%, a difference of 0.12%), Cree (37.0%, a difference of 0.21%), Immigrants from Barbados (36.8%, a difference of 0.22%), Barbadian (37.0%, a difference of 0.23%), and Immigrants from Congo (36.8%, a difference of 0.24%).
| Demographics | Rating | Rank | Births to Unmarried Women |
| Cherokee | 0.1 /100 | #265 | Tragic 36.7% |
| Immigrants | Senegal | 0.1 /100 | #266 | Tragic 36.7% |
| Central Americans | 0.1 /100 | #267 | Tragic 36.7% |
| Comanche | 0.1 /100 | #268 | Tragic 36.7% |
| Senegalese | 0.1 /100 | #269 | Tragic 36.8% |
| Immigrants | Congo | 0.1 /100 | #270 | Tragic 36.8% |
| Immigrants | Barbados | 0.1 /100 | #271 | Tragic 36.8% |
| Choctaw | 0.1 /100 | #272 | Tragic 36.9% |
| Mexicans | 0.1 /100 | #273 | Tragic 36.9% |
| Cree | 0.1 /100 | #274 | Tragic 37.0% |
| Barbadians | 0.1 /100 | #275 | Tragic 37.0% |
| Belizeans | 0.1 /100 | #276 | Tragic 37.0% |
| Guatemalans | 0.1 /100 | #277 | Tragic 37.1% |
| Immigrants | Latin America | 0.1 /100 | #278 | Tragic 37.1% |
| West Indians | 0.1 /100 | #279 | Tragic 37.3% |