Ethiopian vs Immigrants from Afghanistan Family Households

COMPARE

Ethiopian
Race
Ancestry
AfghanAfricanAlaska NativeAlaskan AthabascanAlbanianAleutAlsatianAmericanApacheArabArapahoArgentineanArmenianAssyrian/Chaldean/SyriacAustralianAustrianBahamianBangladeshiBarbadianBasqueBelgianBelizeanBermudanBhutaneseBlackfeetBolivianBrazilianBritishBritish West IndianBulgarianBurmeseCajunCambodianCanadianCape VerdeanCarpatho RusynCelticCentral AmericanCentral American IndianCherokeeCheyenneChickasawChileanChineseChippewaChoctawColombianColvilleComancheCosta RicanCreeCreekCroatianCrowCubanCypriotCzechCzechoslovakianDanishDelawareDominicanDutchDutch West IndianEastern EuropeanEcuadorianEgyptianEnglishEstonianEthiopianEuropeanFijianFilipinoFinnishFrenchFrench American IndianFrench CanadianGermanGerman RussianGhanaianGreekGuamanian/ChamorroGuatemalanGuyaneseHaitianHmongHonduranHopiHoumaHungarianIcelanderIndian (Asian)IndonesianInupiatIranianIraqiIrishIroquoisIsraeliItalianJamaicanJapaneseJordanianKenyanKiowaKoreanLaotianLatvianLebaneseLiberianLithuanianLumbeeLuxembourgerMacedonianMalaysianMalteseMarshalleseMenomineeMexicanMexican American IndianMongolianMoroccanNative HawaiianNavajoNepaleseNew ZealanderNicaraguanNigerianNorthern EuropeanNorwegianOkinawanOsageOttawaPaiutePakistaniPalestinianPanamanianParaguayanPennsylvania GermanPeruvianPimaPolishPortuguesePotawatomiPuebloPuerto RicanPuget Sound SalishRomanianRussianSalvadoranSamoanScandinavianScotch-IrishScottishSeminoleSenegaleseSerbianShoshoneSierra LeoneanSiouxSlavicSlovakSloveneSomaliSouth AfricanSouth AmericanSouth American IndianSoviet UnionSpaniardSpanishSpanish AmericanSpanish American IndianSri LankanSubsaharan AfricanSudaneseSwedishSwissSyrianTaiwaneseThaiTlingit-HaidaTohono O'OdhamTonganTrinidadian and TobagonianTsimshianTurkishU.S. Virgin IslanderUgandanUkrainianUruguayanUteVenezuelanVietnameseWelshWest IndianYakamaYaquiYugoslavianYumanYup'ikZimbabwean
Immigration
NonimmigrantsImmigrantsAfricaAlbaniaArgentinaArmeniaAsiaAustraliaAustriaBahamasBangladeshBarbadosBelarusBelgiumBelizeBoliviaBosnia and HerzegovinaBrazilBulgariaBurma/MyanmarCabo VerdeCambodiaCameroonCanadaCaribbeanCentral AmericaChileChinaColombiaCongoCosta RicaCroatiaCubaCzechoslovakiaDenmarkDominicaDominican RepublicEastern AfricaEastern AsiaEastern EuropeEcuadorEgyptEl SalvadorEnglandEritreaEthiopiaEuropeFijiFranceGermanyGhanaGreeceGrenadaGuatemalaGuyanaHaitiHondurasHong KongHungaryIndiaIndonesiaIranIraqIrelandIsraelItalyJamaicaJapanJordanKazakhstanKenyaKoreaKuwaitLaosLatin AmericaLatviaLebanonLiberiaLithuaniaMalaysiaMexicoMicronesiaMiddle AfricaMoldovaMoroccoNepalNetherlandsNicaraguaNigeriaNorth AmericaNorth MacedoniaNorthern AfricaNorthern EuropeNorwayOceaniaPakistanPanamaPeruPhilippinesPolandPortugalRomaniaRussiaSaudi ArabiaScotlandSenegalSerbiaSierra LeoneSingaporeSomaliaSouth AfricaSouth AmericaSouth Central AsiaSouth Eastern AsiaSouthern EuropeSpainSri LankaSt. Vincent and the GrenadinesSudanSwedenSwitzerlandSyriaTaiwanThailandTrinidad and TobagoTurkeyUgandaUkraineUruguayUzbekistanVenezuelaVietnamWest IndiesWestern AfricaWestern AsiaWestern EuropeYemenZaireZimbabweAzores
Immigrants from Afghanistan
Race
Ancestry
AfghanAfricanAlaska NativeAlaskan AthabascanAlbanianAleutAlsatianAmericanApacheArabArapahoArgentineanArmenianAssyrian/Chaldean/SyriacAustralianAustrianBahamianBangladeshiBarbadianBasqueBelgianBelizeanBermudanBhutaneseBlackfeetBolivianBrazilianBritishBritish West IndianBulgarianBurmeseCajunCambodianCanadianCape VerdeanCarpatho RusynCelticCentral AmericanCentral American IndianCherokeeCheyenneChickasawChileanChineseChippewaChoctawColombianColvilleComancheCosta RicanCreeCreekCroatianCrowCubanCypriotCzechCzechoslovakianDanishDelawareDominicanDutchDutch West IndianEastern EuropeanEcuadorianEgyptianEnglishEstonianEuropeanFijianFilipinoFinnishFrenchFrench American IndianFrench CanadianGermanGerman RussianGhanaianGreekGuamanian/ChamorroGuatemalanGuyaneseHaitianHmongHonduranHopiHoumaHungarianIcelanderIndian (Asian)IndonesianInupiatIranianIraqiIrishIroquoisIsraeliItalianJamaicanJapaneseJordanianKenyanKiowaKoreanLaotianLatvianLebaneseLiberianLithuanianLumbeeLuxembourgerMacedonianMalaysianMalteseMarshalleseMenomineeMexicanMexican American IndianMongolianMoroccanNative HawaiianNavajoNepaleseNew ZealanderNicaraguanNigerianNorthern EuropeanNorwegianOkinawanOsageOttawaPaiutePakistaniPalestinianPanamanianParaguayanPennsylvania GermanPeruvianPimaPolishPortuguesePotawatomiPuebloPuerto RicanPuget Sound SalishRomanianRussianSalvadoranSamoanScandinavianScotch-IrishScottishSeminoleSenegaleseSerbianShoshoneSierra LeoneanSiouxSlavicSlovakSloveneSomaliSouth AfricanSouth AmericanSouth American IndianSoviet UnionSpaniardSpanishSpanish AmericanSpanish American IndianSri LankanSubsaharan AfricanSudaneseSwedishSwissSyrianTaiwaneseThaiTlingit-HaidaTohono O'OdhamTonganTrinidadian and TobagonianTsimshianTurkishU.S. Virgin IslanderUgandanUkrainianUruguayanUteVenezuelanVietnameseWelshWest IndianYakamaYaquiYugoslavianYumanYup'ikZimbabwean
Immigration
NonimmigrantsImmigrantsAfghanistanAfricaAlbaniaArgentinaArmeniaAsiaAustraliaAustriaBahamasBangladeshBarbadosBelarusBelgiumBelizeBoliviaBosnia and HerzegovinaBrazilBulgariaBurma/MyanmarCabo VerdeCambodiaCameroonCanadaCaribbeanCentral AmericaChileChinaColombiaCongoCosta RicaCroatiaCubaCzechoslovakiaDenmarkDominicaDominican RepublicEastern AfricaEastern AsiaEastern EuropeEcuadorEgyptEl SalvadorEnglandEritreaEthiopiaEuropeFijiFranceGermanyGhanaGreeceGrenadaGuatemalaGuyanaHaitiHondurasHong KongHungaryIndiaIndonesiaIranIraqIrelandIsraelItalyJamaicaJapanJordanKazakhstanKenyaKoreaKuwaitLaosLatin AmericaLatviaLebanonLiberiaLithuaniaMalaysiaMexicoMicronesiaMiddle AfricaMoldovaMoroccoNepalNetherlandsNicaraguaNigeriaNorth AmericaNorth MacedoniaNorthern AfricaNorthern EuropeNorwayOceaniaPakistanPanamaPeruPhilippinesPolandPortugalRomaniaRussiaSaudi ArabiaScotlandSenegalSerbiaSierra LeoneSingaporeSomaliaSouth AfricaSouth AmericaSouth Central AsiaSouth Eastern AsiaSouthern EuropeSpainSri LankaSt. Vincent and the GrenadinesSudanSwedenSwitzerlandSyriaTaiwanThailandTrinidad and TobagoTurkeyUgandaUkraineUruguayUzbekistanVenezuelaVietnamWest IndiesWestern AfricaWestern AsiaWestern EuropeYemenZaireZimbabweAzores
Family Households
Income
Poverty
Unemployment
Labor Participation
Family Structure
Vehicle Availability
Education Level
Disability

Family Households Comparison

Ethiopians

Immigrants from Afghanistan

Tragic
Exceptional
61.2%
FAMILY HOUSEHOLDS
0.0/ 100
METRIC RATING
332nd/ 347
METRIC RANK
65.9%
FAMILY HOUSEHOLDS
99.9/ 100
METRIC RATING
70th/ 347
METRIC RANK

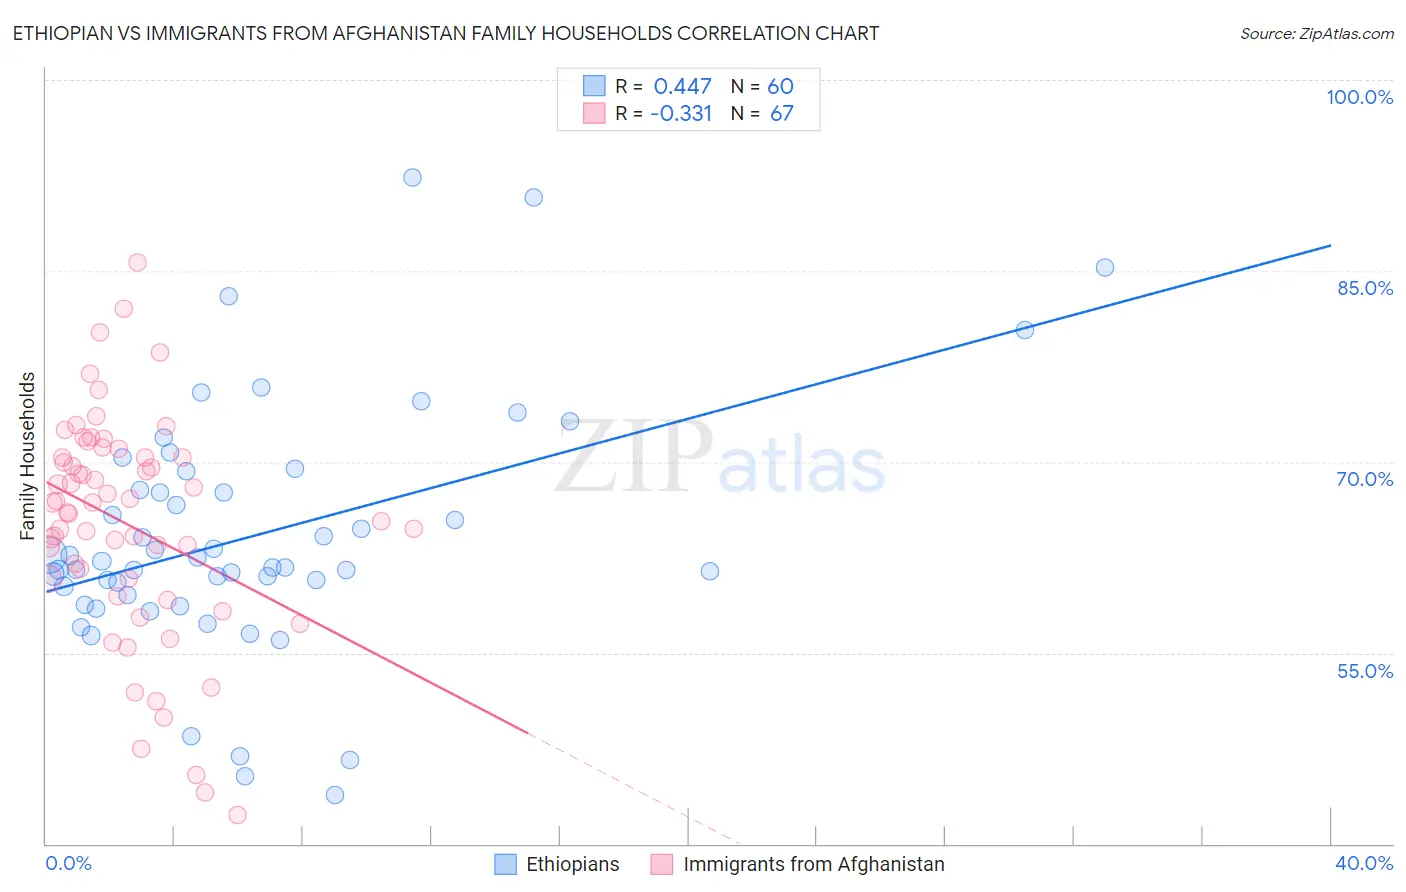
Ethiopian vs Immigrants from Afghanistan Family Households Correlation Chart

The statistical analysis conducted on geographies consisting of 223,101,453 people shows a moderate positive correlation between the proportion of Ethiopians and percentage of family households in the United States with a correlation coefficient (R) of 0.447 and weighted average of 61.2%. Similarly, the statistical analysis conducted on geographies consisting of 147,637,809 people shows a mild negative correlation between the proportion of Immigrants from Afghanistan and percentage of family households in the United States with a correlation coefficient (R) of -0.331 and weighted average of 65.9%, a difference of 7.5%.
Ethiopian vs Immigrants from Afghanistan Family Households

Family Households Correlation Summary

MeasurementEthiopianImmigrants from Afghanistan
Minimum43.8%42.3%
Maximum92.3%85.6%
Range48.5%43.4%
Mean64.2%65.1%
Median62.0%66.8%
Interquartile 25% (IQ1)59.9%60.8%
Interquartile 75% (IQ3)68.5%70.4%
Interquartile Range (IQR)8.6%9.6%
Standard Deviation (Sample)9.7%8.8%
Standard Deviation (Population)9.6%8.7%

Similar Demographics by Family Households

Demographics Similar to Ethiopians by Family Households

In terms of family households, the demographic groups most similar to Ethiopians are Immigrants from France (61.3%, a difference of 0.070%), Immigrants from Australia (61.3%, a difference of 0.080%), Immigrants from Ethiopia (61.2%, a difference of 0.080%), Immigrants from Eastern Africa (61.1%, a difference of 0.16%), and Cambodian (61.4%, a difference of 0.21%).
DemographicsRating | RankFamily Households
Immigrants | Switzerland
0.0
/100
|
#325
Tragic
61.6%
Indonesians
0.0
/100
|
#326
Tragic
61.5%
Blacks/African Americans
0.0
/100
|
#327
Tragic
61.5%
Kiowa
0.0
/100
|
#328
Tragic
61.4%
Cambodians
0.0
/100
|
#329
Tragic
61.4%
Immigrants | Australia
0.0
/100
|
#330
Tragic
61.3%
Immigrants | France
0.0
/100
|
#331
Tragic
61.3%
Ethiopians
0.0
/100
|
#332
Tragic
61.2%
Immigrants | Ethiopia
0.0
/100
|
#333
Tragic
61.2%
Immigrants | Eastern Africa
0.0
/100
|
#334
Tragic
61.1%
Carpatho Rusyns
0.0
/100
|
#335
Tragic
61.1%
German Russians
0.0
/100
|
#336
Tragic
60.9%
Soviet Union
0.0
/100
|
#337
Tragic
60.9%
Immigrants | Eritrea
0.0
/100
|
#338
Tragic
60.8%
Immigrants | Saudi Arabia
0.0
/100
|
#339
Tragic
60.7%

Demographics Similar to Immigrants from Afghanistan by Family Households

In terms of family households, the demographic groups most similar to Immigrants from Afghanistan are Malaysian (65.9%, a difference of 0.010%), Bhutanese (65.9%, a difference of 0.020%), Japanese (65.9%, a difference of 0.040%), Fijian (65.9%, a difference of 0.060%), and Filipino (65.9%, a difference of 0.060%).
DemographicsRating | RankFamily Households
Immigrants | Indonesia
100.0
/100
|
#63
Exceptional
66.0%
Pima
99.9
/100
|
#64
Exceptional
65.9%
Costa Ricans
99.9
/100
|
#65
Exceptional
65.9%
Fijians
99.9
/100
|
#66
Exceptional
65.9%
Filipinos
99.9
/100
|
#67
Exceptional
65.9%
Japanese
99.9
/100
|
#68
Exceptional
65.9%
Malaysians
99.9
/100
|
#69
Exceptional
65.9%
Immigrants | Afghanistan
99.9
/100
|
#70
Exceptional
65.9%
Bhutanese
99.9
/100
|
#71
Exceptional
65.9%
Portuguese
99.9
/100
|
#72
Exceptional
65.8%
Laotians
99.9
/100
|
#73
Exceptional
65.8%
Burmese
99.9
/100
|
#74
Exceptional
65.7%
Houma
99.9
/100
|
#75
Exceptional
65.7%
Immigrants | Azores
99.8
/100
|
#76
Exceptional
65.6%
Immigrants | South America
99.8
/100
|
#77
Exceptional
65.6%