Estonian vs Russian Births to Unmarried Women

COMPARE

Estonian
Race
Ancestry
AfghanAfricanAlaska NativeAlaskan AthabascanAlbanianAleutAlsatianAmericanApacheArabArapahoArgentineanArmenianAssyrian/Chaldean/SyriacAustralianAustrianBahamianBangladeshiBarbadianBasqueBelgianBelizeanBermudanBhutaneseBlackfeetBolivianBrazilianBritishBritish West IndianBulgarianBurmeseCajunCambodianCanadianCape VerdeanCarpatho RusynCelticCentral AmericanCentral American IndianCherokeeCheyenneChickasawChileanChineseChippewaChoctawColombianColvilleComancheCosta RicanCreeCreekCroatianCrowCubanCypriotCzechCzechoslovakianDanishDelawareDominicanDutchDutch West IndianEastern EuropeanEcuadorianEgyptianEnglishEstonianEthiopianEuropeanFijianFilipinoFinnishFrenchFrench American IndianFrench CanadianGermanGerman RussianGhanaianGreekGuamanian/ChamorroGuatemalanGuyaneseHaitianHmongHonduranHopiHoumaHungarianIcelanderIndian (Asian)IndonesianInupiatIranianIraqiIrishIroquoisIsraeliItalianJamaicanJapaneseJordanianKenyanKiowaKoreanLaotianLatvianLebaneseLiberianLithuanianLumbeeLuxembourgerMacedonianMalaysianMalteseMarshalleseMenomineeMexicanMexican American IndianMongolianMoroccanNative HawaiianNavajoNepaleseNew ZealanderNicaraguanNigerianNorthern EuropeanNorwegianOkinawanOsageOttawaPaiutePakistaniPalestinianPanamanianParaguayanPennsylvania GermanPeruvianPimaPolishPortuguesePotawatomiPuebloPuerto RicanPuget Sound SalishRomanianSalvadoranSamoanScandinavianScotch-IrishScottishSeminoleSenegaleseSerbianShoshoneSierra LeoneanSiouxSlavicSlovakSloveneSomaliSouth AfricanSouth AmericanSouth American IndianSoviet UnionSpaniardSpanishSpanish AmericanSpanish American IndianSri LankanSubsaharan AfricanSudaneseSwedishSwissSyrianTaiwaneseThaiTlingit-HaidaTohono O'OdhamTonganTrinidadian and TobagonianTsimshianTurkishU.S. Virgin IslanderUgandanUkrainianUruguayanUteVenezuelanVietnameseWelshWest IndianYakamaYaquiYugoslavianYumanYup'ikZimbabwean
Immigration
NonimmigrantsImmigrantsAfghanistanAfricaAlbaniaArgentinaArmeniaAsiaAustraliaAustriaBahamasBangladeshBarbadosBelarusBelgiumBelizeBoliviaBosnia and HerzegovinaBrazilBulgariaBurma/MyanmarCabo VerdeCambodiaCameroonCanadaCaribbeanCentral AmericaChileChinaColombiaCongoCosta RicaCroatiaCubaCzechoslovakiaDenmarkDominicaDominican RepublicEastern AfricaEastern AsiaEastern EuropeEcuadorEgyptEl SalvadorEnglandEritreaEthiopiaEuropeFijiFranceGermanyGhanaGreeceGrenadaGuatemalaGuyanaHaitiHondurasHong KongHungaryIndiaIndonesiaIranIraqIrelandIsraelItalyJamaicaJapanJordanKazakhstanKenyaKoreaKuwaitLaosLatin AmericaLatviaLebanonLiberiaLithuaniaMalaysiaMexicoMicronesiaMiddle AfricaMoldovaMoroccoNepalNetherlandsNicaraguaNigeriaNorth AmericaNorth MacedoniaNorthern AfricaNorthern EuropeNorwayOceaniaPakistanPanamaPeruPhilippinesPolandPortugalRomaniaRussiaSaudi ArabiaScotlandSenegalSerbiaSierra LeoneSingaporeSomaliaSouth AfricaSouth AmericaSouth Central AsiaSouth Eastern AsiaSouthern EuropeSpainSri LankaSt. Vincent and the GrenadinesSudanSwedenSwitzerlandSyriaTaiwanThailandTrinidad and TobagoTurkeyUgandaUkraineUruguayUzbekistanVenezuelaVietnamWest IndiesWestern AfricaWestern AsiaWestern EuropeYemenZaireZimbabweAzores
Russian
Race
Ancestry
AfghanAfricanAlaska NativeAlaskan AthabascanAlbanianAleutAlsatianAmericanApacheArabArapahoArgentineanArmenianAssyrian/Chaldean/SyriacAustralianAustrianBahamianBangladeshiBarbadianBasqueBelgianBelizeanBermudanBhutaneseBlackfeetBolivianBrazilianBritishBritish West IndianBulgarianBurmeseCajunCambodianCanadianCape VerdeanCarpatho RusynCelticCentral AmericanCentral American IndianCherokeeCheyenneChickasawChileanChineseChippewaChoctawColombianColvilleComancheCosta RicanCreeCreekCroatianCrowCubanCypriotCzechCzechoslovakianDanishDelawareDominicanDutchDutch West IndianEastern EuropeanEcuadorianEgyptianEnglishEthiopianEuropeanFijianFilipinoFinnishFrenchFrench American IndianFrench CanadianGermanGerman RussianGhanaianGreekGuamanian/ChamorroGuatemalanGuyaneseHaitianHmongHonduranHopiHoumaHungarianIcelanderIndian (Asian)IndonesianInupiatIranianIraqiIrishIroquoisIsraeliItalianJamaicanJapaneseJordanianKenyanKiowaKoreanLaotianLatvianLebaneseLiberianLithuanianLumbeeLuxembourgerMacedonianMalaysianMalteseMarshalleseMenomineeMexicanMexican American IndianMongolianMoroccanNative HawaiianNavajoNepaleseNew ZealanderNicaraguanNigerianNorthern EuropeanNorwegianOkinawanOsageOttawaPaiutePakistaniPalestinianPanamanianParaguayanPennsylvania GermanPeruvianPimaPolishPortuguesePotawatomiPuebloPuerto RicanPuget Sound SalishRomanianRussianSalvadoranSamoanScandinavianScotch-IrishScottishSeminoleSenegaleseSerbianShoshoneSierra LeoneanSiouxSlavicSlovakSloveneSomaliSouth AfricanSouth AmericanSouth American IndianSoviet UnionSpaniardSpanishSpanish AmericanSpanish American IndianSri LankanSubsaharan AfricanSudaneseSwedishSwissSyrianTaiwaneseThaiTlingit-HaidaTohono O'OdhamTonganTrinidadian and TobagonianTsimshianTurkishU.S. Virgin IslanderUgandanUkrainianUruguayanUteVenezuelanVietnameseWelshWest IndianYakamaYaquiYugoslavianYumanYup'ikZimbabwean
Immigration
NonimmigrantsImmigrantsAfghanistanAfricaAlbaniaArgentinaArmeniaAsiaAustraliaAustriaBahamasBangladeshBarbadosBelarusBelgiumBelizeBoliviaBosnia and HerzegovinaBrazilBulgariaBurma/MyanmarCabo VerdeCambodiaCameroonCanadaCaribbeanCentral AmericaChileChinaColombiaCongoCosta RicaCroatiaCubaCzechoslovakiaDenmarkDominicaDominican RepublicEastern AfricaEastern AsiaEastern EuropeEcuadorEgyptEl SalvadorEnglandEritreaEthiopiaEuropeFijiFranceGermanyGhanaGreeceGrenadaGuatemalaGuyanaHaitiHondurasHong KongHungaryIndiaIndonesiaIranIraqIrelandIsraelItalyJamaicaJapanJordanKazakhstanKenyaKoreaKuwaitLaosLatin AmericaLatviaLebanonLiberiaLithuaniaMalaysiaMexicoMicronesiaMiddle AfricaMoldovaMoroccoNepalNetherlandsNicaraguaNigeriaNorth AmericaNorth MacedoniaNorthern AfricaNorthern EuropeNorwayOceaniaPakistanPanamaPeruPhilippinesPolandPortugalRomaniaRussiaSaudi ArabiaScotlandSenegalSerbiaSierra LeoneSingaporeSomaliaSouth AfricaSouth AmericaSouth Central AsiaSouth Eastern AsiaSouthern EuropeSpainSri LankaSt. Vincent and the GrenadinesSudanSwedenSwitzerlandSyriaTaiwanThailandTrinidad and TobagoTurkeyUgandaUkraineUruguayUzbekistanVenezuelaVietnamWest IndiesWestern AfricaWestern AsiaWestern EuropeYemenZaireZimbabweAzores
Births to Unmarried Women
Income
Poverty
Unemployment
Labor Participation
Family Structure
Vehicle Availability
Education Level
Disability

Births to Unmarried Women Comparison

Estonians

Russians

Exceptional
Exceptional
29.2%
BIRTHS TO UNMARRIED WOMEN
96.5/ 100
METRIC RATING
93rd/ 347
METRIC RANK
28.0%
BIRTHS TO UNMARRIED WOMEN
99.2/ 100
METRIC RATING
57th/ 347
METRIC RANK

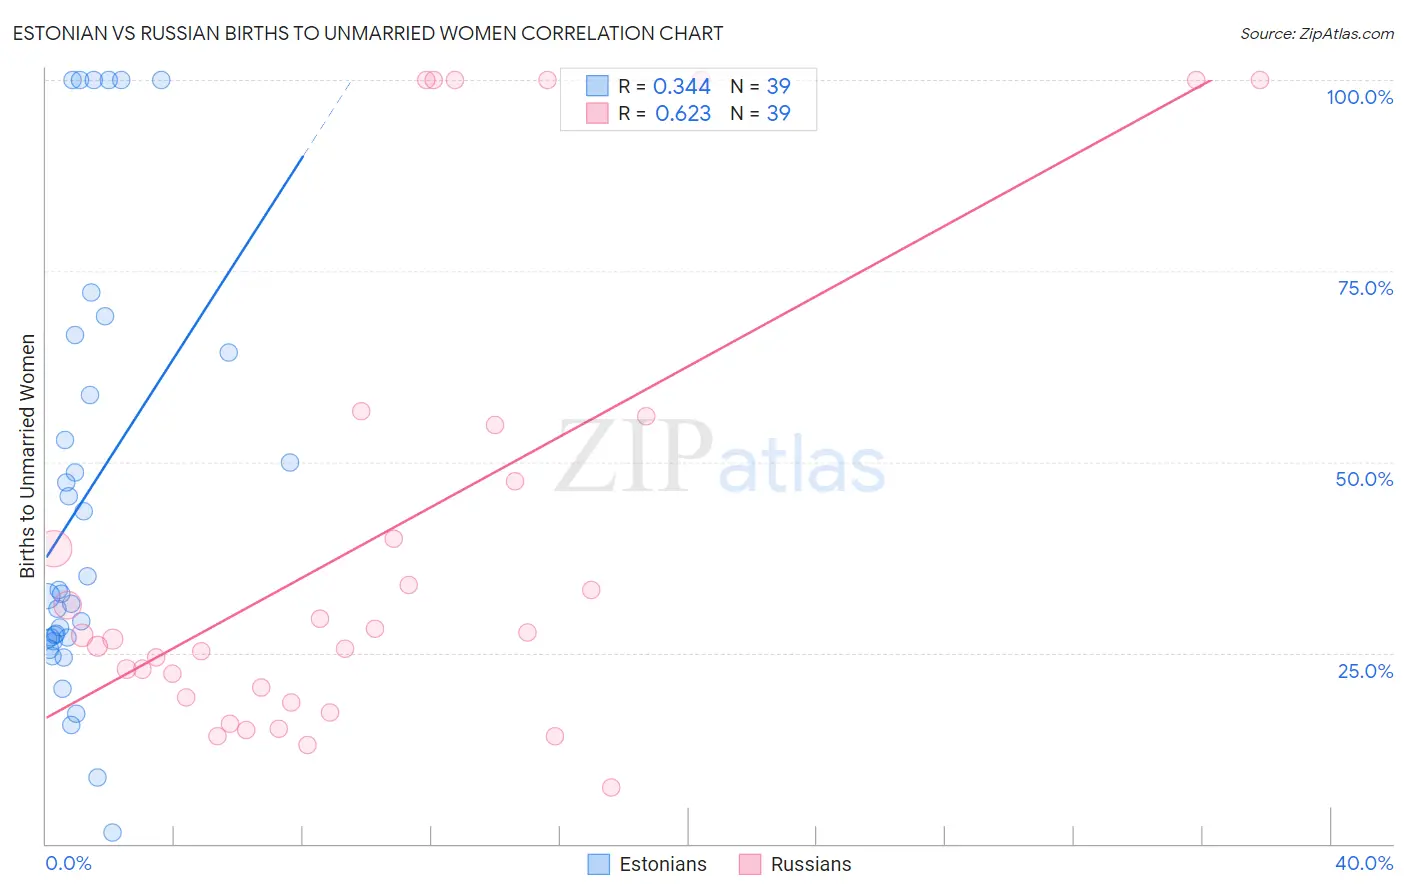
Estonian vs Russian Births to Unmarried Women Correlation Chart

The statistical analysis conducted on geographies consisting of 118,165,296 people shows a mild positive correlation between the proportion of Estonians and percentage of births to unmarried women in the United States with a correlation coefficient (R) of 0.344 and weighted average of 29.2%. Similarly, the statistical analysis conducted on geographies consisting of 462,642,937 people shows a significant positive correlation between the proportion of Russians and percentage of births to unmarried women in the United States with a correlation coefficient (R) of 0.623 and weighted average of 28.0%, a difference of 4.2%.
Estonian vs Russian Births to Unmarried Women

Births to Unmarried Women Correlation Summary

MeasurementEstonianRussian
Minimum1.4%7.4%
Maximum100.0%100.0%
Range98.6%92.6%
Mean45.4%40.2%
Median32.7%27.3%
Interquartile 25% (IQ1)26.9%19.1%
Interquartile 75% (IQ3)64.3%54.9%
Interquartile Range (IQR)37.4%35.7%
Standard Deviation (Sample)28.4%30.6%
Standard Deviation (Population)28.1%30.2%

Similar Demographics by Births to Unmarried Women

Demographics Similar to Estonians by Births to Unmarried Women

In terms of births to unmarried women, the demographic groups most similar to Estonians are Arab (29.2%, a difference of 0.040%), Immigrants from Fiji (29.2%, a difference of 0.080%), Ukrainian (29.2%, a difference of 0.12%), Immigrants from Vietnam (29.3%, a difference of 0.26%), and Immigrants from Latvia (29.1%, a difference of 0.29%).
DemographicsRating | RankBirths to Unmarried Women
Immigrants | Jordan
97.4
/100
|
#86
Exceptional
29.0%
Taiwanese
97.3
/100
|
#87
Exceptional
29.0%
Immigrants | France
97.3
/100
|
#88
Exceptional
29.0%
Immigrants | Saudi Arabia
97.0
/100
|
#89
Exceptional
29.1%
Immigrants | Latvia
96.8
/100
|
#90
Exceptional
29.1%
Immigrants | Fiji
96.6
/100
|
#91
Exceptional
29.2%
Arabs
96.5
/100
|
#92
Exceptional
29.2%
Estonians
96.5
/100
|
#93
Exceptional
29.2%
Ukrainians
96.3
/100
|
#94
Exceptional
29.2%
Immigrants | Vietnam
96.1
/100
|
#95
Exceptional
29.3%
Norwegians
95.8
/100
|
#96
Exceptional
29.3%
Immigrants | South Africa
95.7
/100
|
#97
Exceptional
29.3%
Immigrants | Syria
95.7
/100
|
#98
Exceptional
29.4%
Immigrants | Denmark
95.3
/100
|
#99
Exceptional
29.4%
Luxembourgers
95.2
/100
|
#100
Exceptional
29.4%

Demographics Similar to Russians by Births to Unmarried Women

In terms of births to unmarried women, the demographic groups most similar to Russians are Immigrants from Albania (28.0%, a difference of 0.11%), Immigrants from Belgium (28.0%, a difference of 0.13%), Immigrants from Kazakhstan (28.1%, a difference of 0.36%), Mongolian (27.9%, a difference of 0.39%), and Immigrants from Turkey (28.1%, a difference of 0.41%).
DemographicsRating | RankBirths to Unmarried Women
Maltese
99.4
/100
|
#50
Exceptional
27.8%
Macedonians
99.4
/100
|
#51
Exceptional
27.9%
Bhutanese
99.4
/100
|
#52
Exceptional
27.9%
Immigrants | Romania
99.4
/100
|
#53
Exceptional
27.9%
Afghans
99.4
/100
|
#54
Exceptional
27.9%
Mongolians
99.3
/100
|
#55
Exceptional
27.9%
Immigrants | Belgium
99.3
/100
|
#56
Exceptional
28.0%
Russians
99.2
/100
|
#57
Exceptional
28.0%
Immigrants | Albania
99.2
/100
|
#58
Exceptional
28.0%
Immigrants | Kazakhstan
99.1
/100
|
#59
Exceptional
28.1%
Immigrants | Turkey
99.1
/100
|
#60
Exceptional
28.1%
Immigrants | North Macedonia
99.1
/100
|
#61
Exceptional
28.1%
Egyptians
99.0
/100
|
#62
Exceptional
28.2%
Immigrants | Serbia
98.9
/100
|
#63
Exceptional
28.3%
Tongans
98.8
/100
|
#64
Exceptional
28.4%