Dutch vs Australian Family Households
COMPARE
Dutch
Australian
Family Households
Family Households Comparison
Dutch
Australians
64.9%
FAMILY HOUSEHOLDS
95.1/ 100
METRIC RATING
118th/ 347
METRIC RANK
62.8%
FAMILY HOUSEHOLDS
0.1/ 100
METRIC RATING
284th/ 347
METRIC RANK
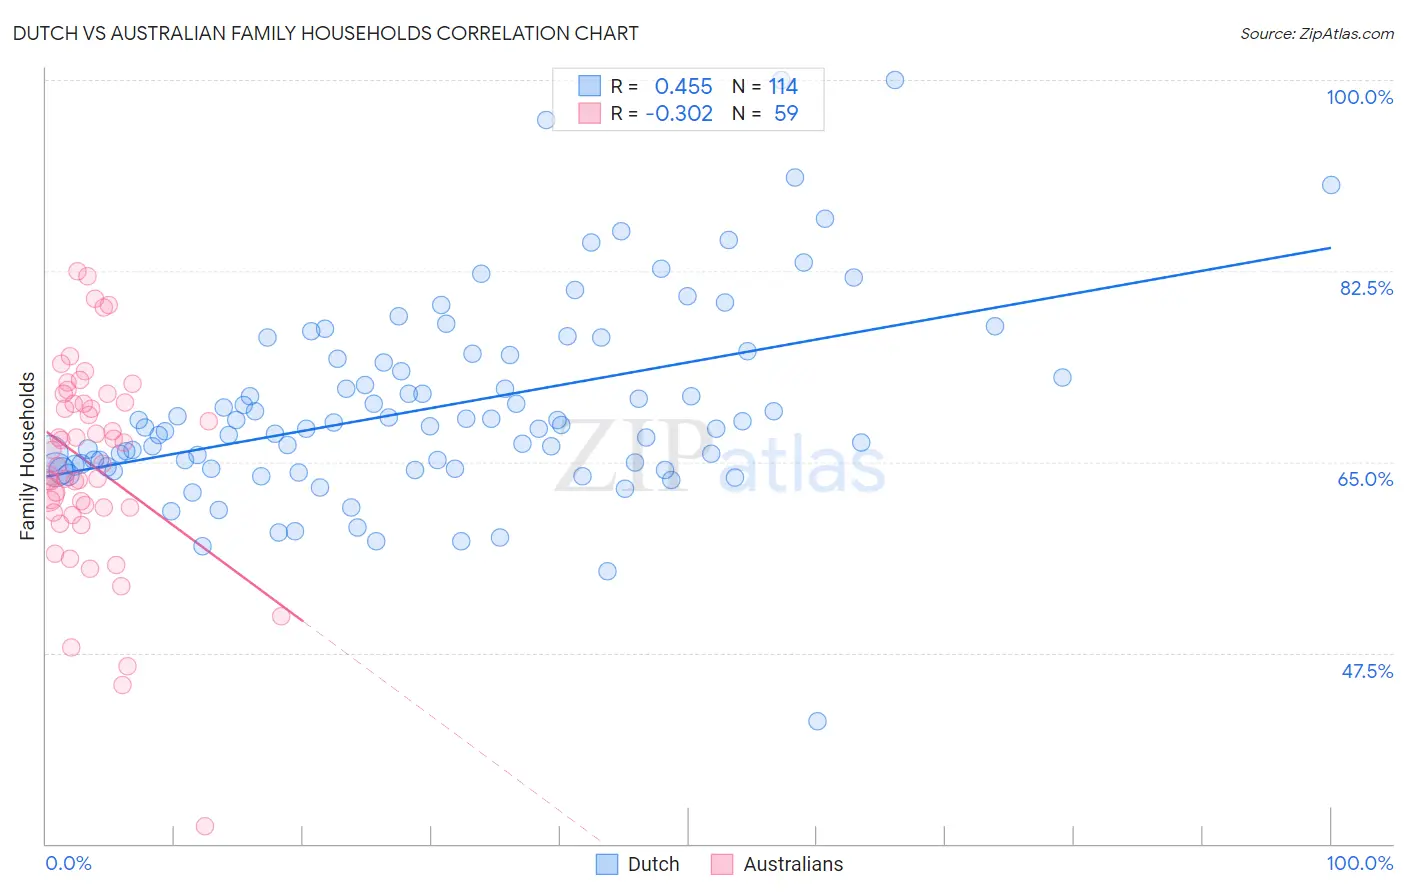
Dutch vs Australian Family Households Correlation Chart
The statistical analysis conducted on geographies consisting of 553,876,441 people shows a moderate positive correlation between the proportion of Dutch and percentage of family households in the United States with a correlation coefficient (R) of 0.455 and weighted average of 64.9%. Similarly, the statistical analysis conducted on geographies consisting of 224,034,220 people shows a mild negative correlation between the proportion of Australians and percentage of family households in the United States with a correlation coefficient (R) of -0.302 and weighted average of 62.8%, a difference of 3.3%.
Family Households Correlation Summary
| Measurement | Dutch | Australian |
| Minimum | 41.2% | 31.6% |
| Maximum | 100.0% | 82.4% |
| Range | 58.8% | 50.9% |
| Mean | 70.0% | 64.8% |
| Median | 68.2% | 64.9% |
| Interquartile 25% (IQ1) | 64.5% | 60.9% |
| Interquartile 75% (IQ3) | 74.5% | 70.5% |
| Interquartile Range (IQR) | 9.9% | 9.6% |
| Standard Deviation (Sample) | 9.1% | 9.3% |
| Standard Deviation (Population) | 9.1% | 9.2% |
Similar Demographics by Family Households
Demographics Similar to Dutch by Family Households
In terms of family households, the demographic groups most similar to Dutch are Ecuadorian (65.0%, a difference of 0.020%), Immigrants from Iraq (65.0%, a difference of 0.020%), Cherokee (65.0%, a difference of 0.020%), Immigrants from Eastern Asia (64.9%, a difference of 0.040%), and Argentinean (65.0%, a difference of 0.050%).
| Demographics | Rating | Rank | Family Households |
| Europeans | 96.8 /100 | #111 | Exceptional 65.0% |
| Immigrants | Jordan | 96.5 /100 | #112 | Exceptional 65.0% |
| Spanish | 96.2 /100 | #113 | Exceptional 65.0% |
| Argentineans | 95.7 /100 | #114 | Exceptional 65.0% |
| Ecuadorians | 95.4 /100 | #115 | Exceptional 65.0% |
| Immigrants | Iraq | 95.4 /100 | #116 | Exceptional 65.0% |
| Cherokee | 95.3 /100 | #117 | Exceptional 65.0% |
| Dutch | 95.1 /100 | #118 | Exceptional 64.9% |
| Immigrants | Eastern Asia | 94.4 /100 | #119 | Exceptional 64.9% |
| Immigrants | Oceania | 94.2 /100 | #120 | Exceptional 64.9% |
| Hungarians | 94.0 /100 | #121 | Exceptional 64.9% |
| Hmong | 93.4 /100 | #122 | Exceptional 64.9% |
| Choctaw | 93.4 /100 | #123 | Exceptional 64.9% |
| Immigrants | Argentina | 92.8 /100 | #124 | Exceptional 64.9% |
| Immigrants | Belize | 92.7 /100 | #125 | Exceptional 64.9% |
Demographics Similar to Australians by Family Households
In terms of family households, the demographic groups most similar to Australians are Immigrants from Denmark (62.9%, a difference of 0.040%), New Zealander (62.9%, a difference of 0.050%), Estonian (62.9%, a difference of 0.080%), Mongolian (62.8%, a difference of 0.10%), and British West Indian (62.8%, a difference of 0.13%).
| Demographics | Rating | Rank | Family Households |
| Ottawa | 0.3 /100 | #277 | Tragic 63.0% |
| Immigrants | Belgium | 0.2 /100 | #278 | Tragic 63.0% |
| Immigrants | Yemen | 0.2 /100 | #279 | Tragic 63.0% |
| Immigrants | Bulgaria | 0.2 /100 | #280 | Tragic 63.0% |
| Estonians | 0.2 /100 | #281 | Tragic 62.9% |
| New Zealanders | 0.1 /100 | #282 | Tragic 62.9% |
| Immigrants | Denmark | 0.1 /100 | #283 | Tragic 62.9% |
| Australians | 0.1 /100 | #284 | Tragic 62.8% |
| Mongolians | 0.1 /100 | #285 | Tragic 62.8% |
| British West Indians | 0.1 /100 | #286 | Tragic 62.8% |
| Latvians | 0.1 /100 | #287 | Tragic 62.8% |
| Immigrants | Uganda | 0.1 /100 | #288 | Tragic 62.7% |
| Immigrants | Nepal | 0.1 /100 | #289 | Tragic 62.7% |
| Immigrants | Grenada | 0.0 /100 | #290 | Tragic 62.6% |
| U.S. Virgin Islanders | 0.0 /100 | #291 | Tragic 62.6% |