Comanche vs Cree Average Family Size
COMPARE
Comanche
Cree
Average Family Size
Average Family Size Comparison
Comanche
Cree
3.25
AVERAGE FAMILY SIZE
82.8/ 100
METRIC RATING
136th/ 347
METRIC RANK
3.19
AVERAGE FAMILY SIZE
6.2/ 100
METRIC RATING
225th/ 347
METRIC RANK
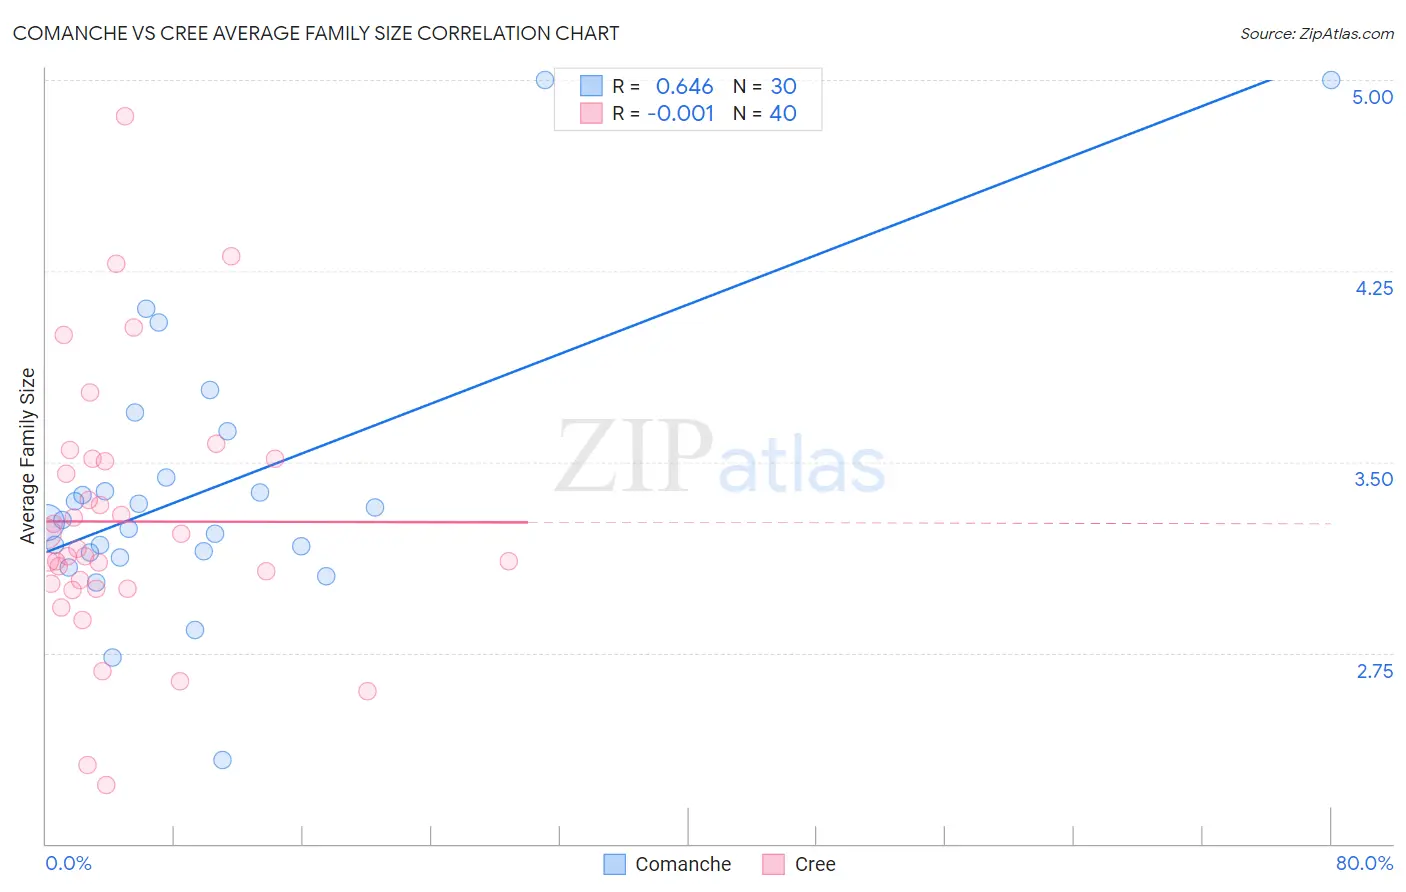
Comanche vs Cree Average Family Size Correlation Chart
The statistical analysis conducted on geographies consisting of 109,768,094 people shows a significant positive correlation between the proportion of Comanche and average family size in the United States with a correlation coefficient (R) of 0.646 and weighted average of 3.25. Similarly, the statistical analysis conducted on geographies consisting of 76,209,902 people shows no correlation between the proportion of Cree and average family size in the United States with a correlation coefficient (R) of -0.001 and weighted average of 3.19, a difference of 2.0%.
Average Family Size Correlation Summary
| Measurement | Comanche | Cree |
| Minimum | 2.33 | 2.23 |
| Maximum | 5.00 | 4.86 |
| Range | 2.67 | 2.63 |
| Mean | 3.39 | 3.27 |
| Median | 3.27 | 3.14 |
| Interquartile 25% (IQ1) | 3.14 | 3.01 |
| Interquartile 75% (IQ3) | 3.44 | 3.51 |
| Interquartile Range (IQR) | 0.30 | 0.49 |
| Standard Deviation (Sample) | 0.56 | 0.52 |
| Standard Deviation (Population) | 0.55 | 0.51 |
Similar Demographics by Average Family Size
Demographics Similar to Comanche by Average Family Size
In terms of average family size, the demographic groups most similar to Comanche are Immigrants from Middle Africa (3.25, a difference of 0.010%), Cuban (3.25, a difference of 0.030%), Immigrants from Ethiopia (3.25, a difference of 0.040%), Subsaharan African (3.25, a difference of 0.040%), and Venezuelan (3.25, a difference of 0.040%).
| Demographics | Rating | Rank | Average Family Size |
| Immigrants | Hong Kong | 88.6 /100 | #129 | Excellent 3.26 |
| Laotians | 88.5 /100 | #130 | Excellent 3.26 |
| Immigrants | Western Asia | 87.7 /100 | #131 | Excellent 3.26 |
| Costa Ricans | 86.8 /100 | #132 | Excellent 3.26 |
| Immigrants | Venezuela | 86.3 /100 | #133 | Excellent 3.26 |
| Africans | 84.9 /100 | #134 | Excellent 3.25 |
| Panamanians | 84.2 /100 | #135 | Excellent 3.25 |
| Comanche | 82.8 /100 | #136 | Excellent 3.25 |
| Immigrants | Middle Africa | 82.4 /100 | #137 | Excellent 3.25 |
| Cubans | 81.8 /100 | #138 | Excellent 3.25 |
| Immigrants | Ethiopia | 81.6 /100 | #139 | Excellent 3.25 |
| Sub-Saharan Africans | 81.6 /100 | #140 | Excellent 3.25 |
| Venezuelans | 81.4 /100 | #141 | Excellent 3.25 |
| Liberians | 81.2 /100 | #142 | Excellent 3.25 |
| Bhutanese | 81.0 /100 | #143 | Excellent 3.25 |
Demographics Similar to Cree by Average Family Size
In terms of average family size, the demographic groups most similar to Cree are Syrian (3.19, a difference of 0.020%), Chickasaw (3.19, a difference of 0.020%), Portuguese (3.19, a difference of 0.020%), Nonimmigrants (3.19, a difference of 0.040%), and Immigrants from Zimbabwe (3.19, a difference of 0.060%).
| Demographics | Rating | Rank | Average Family Size |
| French American Indians | 9.8 /100 | #218 | Tragic 3.20 |
| Pennsylvania Germans | 9.3 /100 | #219 | Tragic 3.19 |
| Lebanese | 9.1 /100 | #220 | Tragic 3.19 |
| Immigrants | Ukraine | 7.2 /100 | #221 | Tragic 3.19 |
| Immigrants | Kuwait | 7.2 /100 | #222 | Tragic 3.19 |
| Immigrants | Zimbabwe | 7.1 /100 | #223 | Tragic 3.19 |
| Syrians | 6.5 /100 | #224 | Tragic 3.19 |
| Cree | 6.2 /100 | #225 | Tragic 3.19 |
| Chickasaw | 6.0 /100 | #226 | Tragic 3.19 |
| Portuguese | 6.0 /100 | #227 | Tragic 3.19 |
| Immigrants | Nonimmigrants | 5.7 /100 | #228 | Tragic 3.19 |
| Immigrants | Italy | 5.3 /100 | #229 | Tragic 3.19 |
| Icelanders | 5.2 /100 | #230 | Tragic 3.19 |
| Basques | 5.2 /100 | #231 | Tragic 3.19 |
| Cherokee | 4.7 /100 | #232 | Tragic 3.18 |