Colville vs Immigrants from Western Europe Divorced or Separated
COMPARE
Colville
Immigrants from Western Europe
Divorced or Separated
Divorced or Separated Comparison
Colville
Immigrants from Western Europe
14.2%
DIVORCED OR SEPARATED
0.0/ 100
METRIC RATING
339th/ 347
METRIC RANK
12.1%
DIVORCED OR SEPARATED
45.6/ 100
METRIC RATING
179th/ 347
METRIC RANK
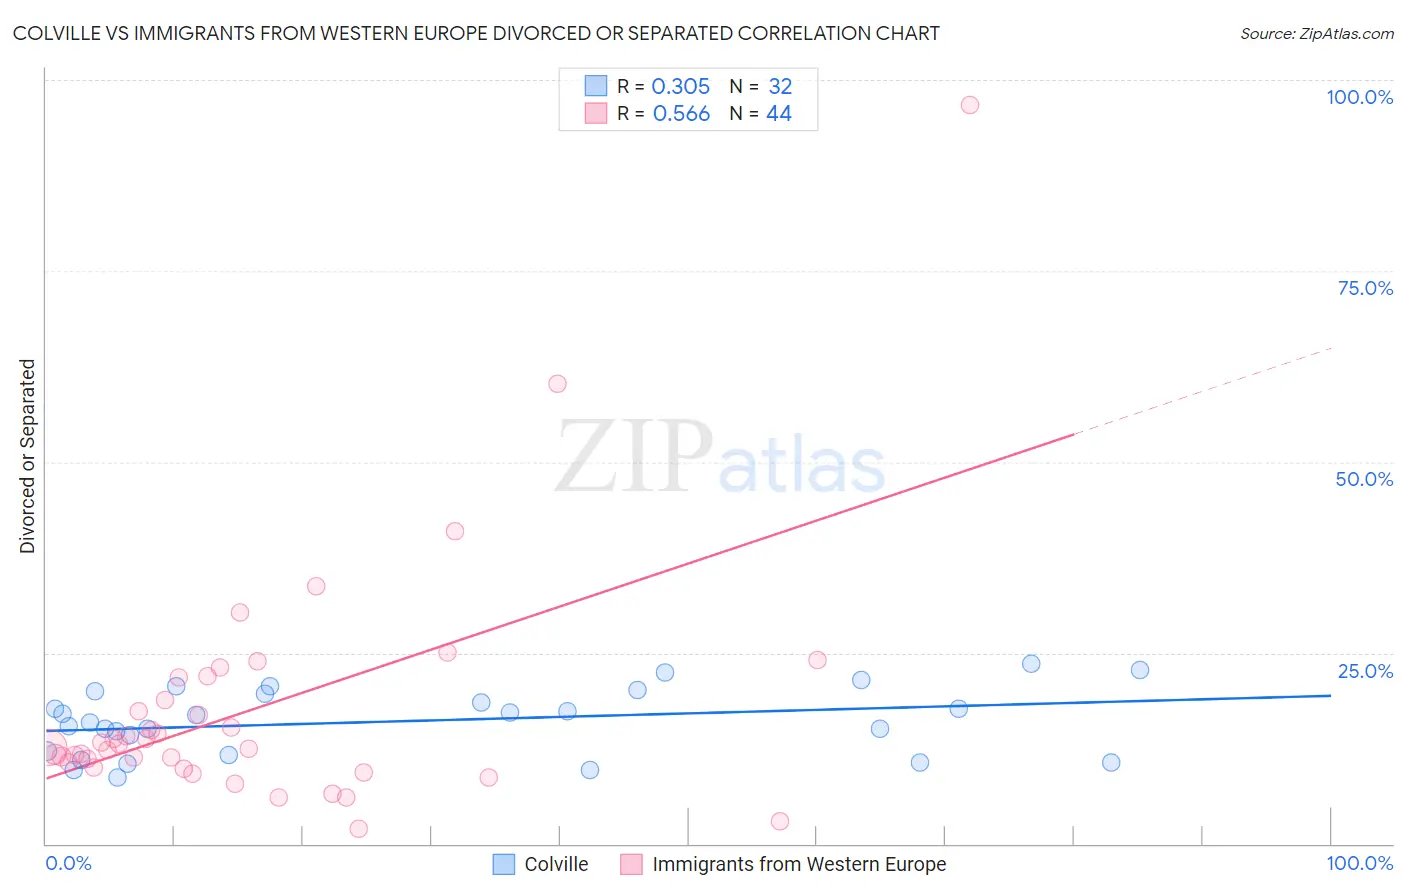
Colville vs Immigrants from Western Europe Divorced or Separated Correlation Chart
The statistical analysis conducted on geographies consisting of 34,683,925 people shows a mild positive correlation between the proportion of Colville and percentage of population currently divorced or separated in the United States with a correlation coefficient (R) of 0.305 and weighted average of 14.2%. Similarly, the statistical analysis conducted on geographies consisting of 493,891,815 people shows a substantial positive correlation between the proportion of Immigrants from Western Europe and percentage of population currently divorced or separated in the United States with a correlation coefficient (R) of 0.566 and weighted average of 12.1%, a difference of 17.6%.
Divorced or Separated Correlation Summary
| Measurement | Colville | Immigrants from Western Europe |
| Minimum | 8.6% | 1.9% |
| Maximum | 23.6% | 96.8% |
| Range | 15.0% | 94.9% |
| Mean | 16.0% | 17.6% |
| Median | 16.4% | 12.9% |
| Interquartile 25% (IQ1) | 11.9% | 10.3% |
| Interquartile 75% (IQ3) | 19.8% | 20.3% |
| Interquartile Range (IQR) | 8.0% | 9.9% |
| Standard Deviation (Sample) | 4.3% | 16.0% |
| Standard Deviation (Population) | 4.2% | 15.8% |
Similar Demographics by Divorced or Separated
Demographics Similar to Colville by Divorced or Separated
In terms of divorced or separated, the demographic groups most similar to Colville are Chickasaw (14.2%, a difference of 0.040%), Bahamian (14.2%, a difference of 0.24%), Seminole (14.3%, a difference of 0.40%), Choctaw (14.1%, a difference of 0.53%), and Crow (14.1%, a difference of 0.84%).
| Demographics | Rating | Rank | Divorced or Separated |
| Cherokee | 0.0 /100 | #332 | Tragic 13.7% |
| Puerto Ricans | 0.0 /100 | #333 | Tragic 13.9% |
| Immigrants | Bahamas | 0.0 /100 | #334 | Tragic 13.9% |
| Dutch West Indians | 0.0 /100 | #335 | Tragic 14.0% |
| Shoshone | 0.0 /100 | #336 | Tragic 14.0% |
| Crow | 0.0 /100 | #337 | Tragic 14.1% |
| Choctaw | 0.0 /100 | #338 | Tragic 14.1% |
| Colville | 0.0 /100 | #339 | Tragic 14.2% |
| Chickasaw | 0.0 /100 | #340 | Tragic 14.2% |
| Bahamians | 0.0 /100 | #341 | Tragic 14.2% |
| Seminole | 0.0 /100 | #342 | Tragic 14.3% |
| Creek | 0.0 /100 | #343 | Tragic 14.4% |
| Cubans | 0.0 /100 | #344 | Tragic 14.5% |
| Kiowa | 0.0 /100 | #345 | Tragic 14.5% |
| Arapaho | 0.0 /100 | #346 | Tragic 14.8% |
Demographics Similar to Immigrants from Western Europe by Divorced or Separated
In terms of divorced or separated, the demographic groups most similar to Immigrants from Western Europe are Ghanaian (12.1%, a difference of 0.010%), Barbadian (12.1%, a difference of 0.020%), Immigrants from Canada (12.1%, a difference of 0.050%), Brazilian (12.1%, a difference of 0.080%), and Immigrants from Ethiopia (12.1%, a difference of 0.090%).
| Demographics | Rating | Rank | Divorced or Separated |
| Immigrants | Mexico | 53.2 /100 | #172 | Average 12.0% |
| Immigrants | Moldova | 50.4 /100 | #173 | Average 12.1% |
| Hawaiians | 50.0 /100 | #174 | Average 12.1% |
| Immigrants | Sierra Leone | 50.0 /100 | #175 | Average 12.1% |
| Pennsylvania Germans | 48.9 /100 | #176 | Average 12.1% |
| Brazilians | 47.7 /100 | #177 | Average 12.1% |
| Ghanaians | 45.9 /100 | #178 | Average 12.1% |
| Immigrants | Western Europe | 45.6 /100 | #179 | Average 12.1% |
| Barbadians | 45.0 /100 | #180 | Average 12.1% |
| Immigrants | Canada | 44.0 /100 | #181 | Average 12.1% |
| Immigrants | Ethiopia | 43.1 /100 | #182 | Average 12.1% |
| Immigrants | Central America | 42.9 /100 | #183 | Average 12.1% |
| Immigrants | North America | 41.1 /100 | #184 | Average 12.1% |
| Immigrants | Nigeria | 40.5 /100 | #185 | Average 12.1% |
| Immigrants | Chile | 39.0 /100 | #186 | Fair 12.1% |