Colombian vs Immigrants from Western Europe Family Households

COMPARE

Colombian
Race
Ancestry
AfghanAfricanAlaska NativeAlaskan AthabascanAlbanianAleutAlsatianAmericanApacheArabArapahoArgentineanArmenianAssyrian/Chaldean/SyriacAustralianAustrianBahamianBangladeshiBarbadianBasqueBelgianBelizeanBermudanBhutaneseBlackfeetBolivianBrazilianBritishBritish West IndianBulgarianBurmeseCajunCambodianCanadianCape VerdeanCarpatho RusynCelticCentral AmericanCentral American IndianCherokeeCheyenneChickasawChileanChineseChippewaChoctawColombianColvilleComancheCosta RicanCreeCreekCroatianCrowCubanCypriotCzechCzechoslovakianDanishDelawareDominicanDutchDutch West IndianEastern EuropeanEcuadorianEgyptianEnglishEstonianEthiopianEuropeanFijianFilipinoFinnishFrenchFrench American IndianFrench CanadianGermanGerman RussianGhanaianGreekGuamanian/ChamorroGuatemalanGuyaneseHaitianHmongHonduranHopiHoumaHungarianIcelanderIndian (Asian)IndonesianInupiatIranianIraqiIrishIroquoisIsraeliItalianJamaicanJapaneseJordanianKenyanKiowaKoreanLaotianLatvianLebaneseLiberianLithuanianLumbeeLuxembourgerMacedonianMalaysianMalteseMarshalleseMenomineeMexicanMexican American IndianMongolianMoroccanNative HawaiianNavajoNepaleseNew ZealanderNicaraguanNigerianNorthern EuropeanNorwegianOkinawanOsageOttawaPaiutePakistaniPalestinianPanamanianParaguayanPennsylvania GermanPeruvianPimaPolishPortuguesePotawatomiPuebloPuerto RicanPuget Sound SalishRomanianRussianSalvadoranSamoanScandinavianScotch-IrishScottishSeminoleSenegaleseSerbianShoshoneSierra LeoneanSiouxSlavicSlovakSloveneSomaliSouth AfricanSouth AmericanSouth American IndianSoviet UnionSpaniardSpanishSpanish AmericanSpanish American IndianSri LankanSubsaharan AfricanSudaneseSwedishSwissSyrianTaiwaneseThaiTlingit-HaidaTohono O'OdhamTonganTrinidadian and TobagonianTsimshianTurkishU.S. Virgin IslanderUgandanUkrainianUruguayanUteVenezuelanVietnameseWelshWest IndianYakamaYaquiYugoslavianYumanYup'ikZimbabwean
Immigration
NonimmigrantsImmigrantsAfghanistanAfricaAlbaniaArgentinaArmeniaAsiaAustraliaAustriaBahamasBangladeshBarbadosBelarusBelgiumBelizeBoliviaBosnia and HerzegovinaBrazilBulgariaBurma/MyanmarCabo VerdeCambodiaCameroonCanadaCaribbeanCentral AmericaChileChinaColombiaCongoCosta RicaCroatiaCubaCzechoslovakiaDenmarkDominicaDominican RepublicEastern AfricaEastern AsiaEastern EuropeEcuadorEgyptEl SalvadorEnglandEritreaEthiopiaEuropeFijiFranceGermanyGhanaGreeceGrenadaGuatemalaGuyanaHaitiHondurasHong KongHungaryIndiaIndonesiaIranIraqIrelandIsraelItalyJamaicaJapanJordanKazakhstanKenyaKoreaKuwaitLaosLatin AmericaLatviaLebanonLiberiaLithuaniaMalaysiaMexicoMicronesiaMiddle AfricaMoldovaMoroccoNepalNetherlandsNicaraguaNigeriaNorth AmericaNorth MacedoniaNorthern AfricaNorthern EuropeNorwayOceaniaPakistanPanamaPeruPhilippinesPolandPortugalRomaniaRussiaSaudi ArabiaScotlandSenegalSerbiaSierra LeoneSingaporeSomaliaSouth AfricaSouth AmericaSouth Central AsiaSouth Eastern AsiaSouthern EuropeSpainSri LankaSt. Vincent and the GrenadinesSudanSwedenSwitzerlandSyriaTaiwanThailandTrinidad and TobagoTurkeyUgandaUkraineUruguayUzbekistanVenezuelaVietnamWest IndiesWestern AfricaWestern AsiaYemenZaireZimbabweAzores
Immigrants from Western Europe
Race
Ancestry
AfghanAfricanAlaska NativeAlaskan AthabascanAlbanianAleutAlsatianAmericanApacheArabArapahoArgentineanArmenianAssyrian/Chaldean/SyriacAustralianAustrianBahamianBangladeshiBarbadianBasqueBelgianBelizeanBermudanBhutaneseBlackfeetBolivianBrazilianBritishBritish West IndianBulgarianBurmeseCajunCambodianCanadianCape VerdeanCarpatho RusynCelticCentral AmericanCentral American IndianCherokeeCheyenneChickasawChileanChineseChippewaChoctawColvilleComancheCosta RicanCreeCreekCroatianCrowCubanCypriotCzechCzechoslovakianDanishDelawareDominicanDutchDutch West IndianEastern EuropeanEcuadorianEgyptianEnglishEstonianEthiopianEuropeanFijianFilipinoFinnishFrenchFrench American IndianFrench CanadianGermanGerman RussianGhanaianGreekGuamanian/ChamorroGuatemalanGuyaneseHaitianHmongHonduranHopiHoumaHungarianIcelanderIndian (Asian)IndonesianInupiatIranianIraqiIrishIroquoisIsraeliItalianJamaicanJapaneseJordanianKenyanKiowaKoreanLaotianLatvianLebaneseLiberianLithuanianLumbeeLuxembourgerMacedonianMalaysianMalteseMarshalleseMenomineeMexicanMexican American IndianMongolianMoroccanNative HawaiianNavajoNepaleseNew ZealanderNicaraguanNigerianNorthern EuropeanNorwegianOkinawanOsageOttawaPaiutePakistaniPalestinianPanamanianParaguayanPennsylvania GermanPeruvianPimaPolishPortuguesePotawatomiPuebloPuerto RicanPuget Sound SalishRomanianRussianSalvadoranSamoanScandinavianScotch-IrishScottishSeminoleSenegaleseSerbianShoshoneSierra LeoneanSiouxSlavicSlovakSloveneSomaliSouth AfricanSouth AmericanSouth American IndianSoviet UnionSpaniardSpanishSpanish AmericanSpanish American IndianSri LankanSubsaharan AfricanSudaneseSwedishSwissSyrianTaiwaneseThaiTlingit-HaidaTohono O'OdhamTonganTrinidadian and TobagonianTsimshianTurkishU.S. Virgin IslanderUgandanUkrainianUruguayanUteVenezuelanVietnameseWelshWest IndianYakamaYaquiYugoslavianYumanYup'ikZimbabwean
Immigration
NonimmigrantsImmigrantsAfghanistanAfricaAlbaniaArgentinaArmeniaAsiaAustraliaAustriaBahamasBangladeshBarbadosBelarusBelgiumBelizeBoliviaBosnia and HerzegovinaBrazilBulgariaBurma/MyanmarCabo VerdeCambodiaCameroonCanadaCaribbeanCentral AmericaChileChinaColombiaCongoCosta RicaCroatiaCubaCzechoslovakiaDenmarkDominicaDominican RepublicEastern AfricaEastern AsiaEastern EuropeEcuadorEgyptEl SalvadorEnglandEritreaEthiopiaEuropeFijiFranceGermanyGhanaGreeceGrenadaGuatemalaGuyanaHaitiHondurasHong KongHungaryIndiaIndonesiaIranIraqIrelandIsraelItalyJamaicaJapanJordanKazakhstanKenyaKoreaKuwaitLaosLatin AmericaLatviaLebanonLiberiaLithuaniaMalaysiaMexicoMicronesiaMiddle AfricaMoldovaMoroccoNepalNetherlandsNicaraguaNigeriaNorth AmericaNorth MacedoniaNorthern AfricaNorthern EuropeNorwayOceaniaPakistanPanamaPeruPhilippinesPolandPortugalRomaniaRussiaSaudi ArabiaScotlandSenegalSerbiaSierra LeoneSingaporeSomaliaSouth AfricaSouth AmericaSouth Central AsiaSouth Eastern AsiaSouthern EuropeSpainSri LankaSt. Vincent and the GrenadinesSudanSwedenSwitzerlandSyriaTaiwanThailandTrinidad and TobagoTurkeyUgandaUkraineUruguayUzbekistanVenezuelaVietnamWest IndiesWestern AfricaWestern AsiaWestern EuropeYemenZaireZimbabweAzores
Family Households
Income
Poverty
Unemployment
Labor Participation
Family Structure
Vehicle Availability
Education Level
Disability

Family Households Comparison

Colombians

Immigrants from Western Europe

Exceptional
Tragic
66.3%
FAMILY HOUSEHOLDS
100.0/ 100
METRIC RATING
52nd/ 347
METRIC RANK
63.2%
FAMILY HOUSEHOLDS
0.6/ 100
METRIC RATING
259th/ 347
METRIC RANK

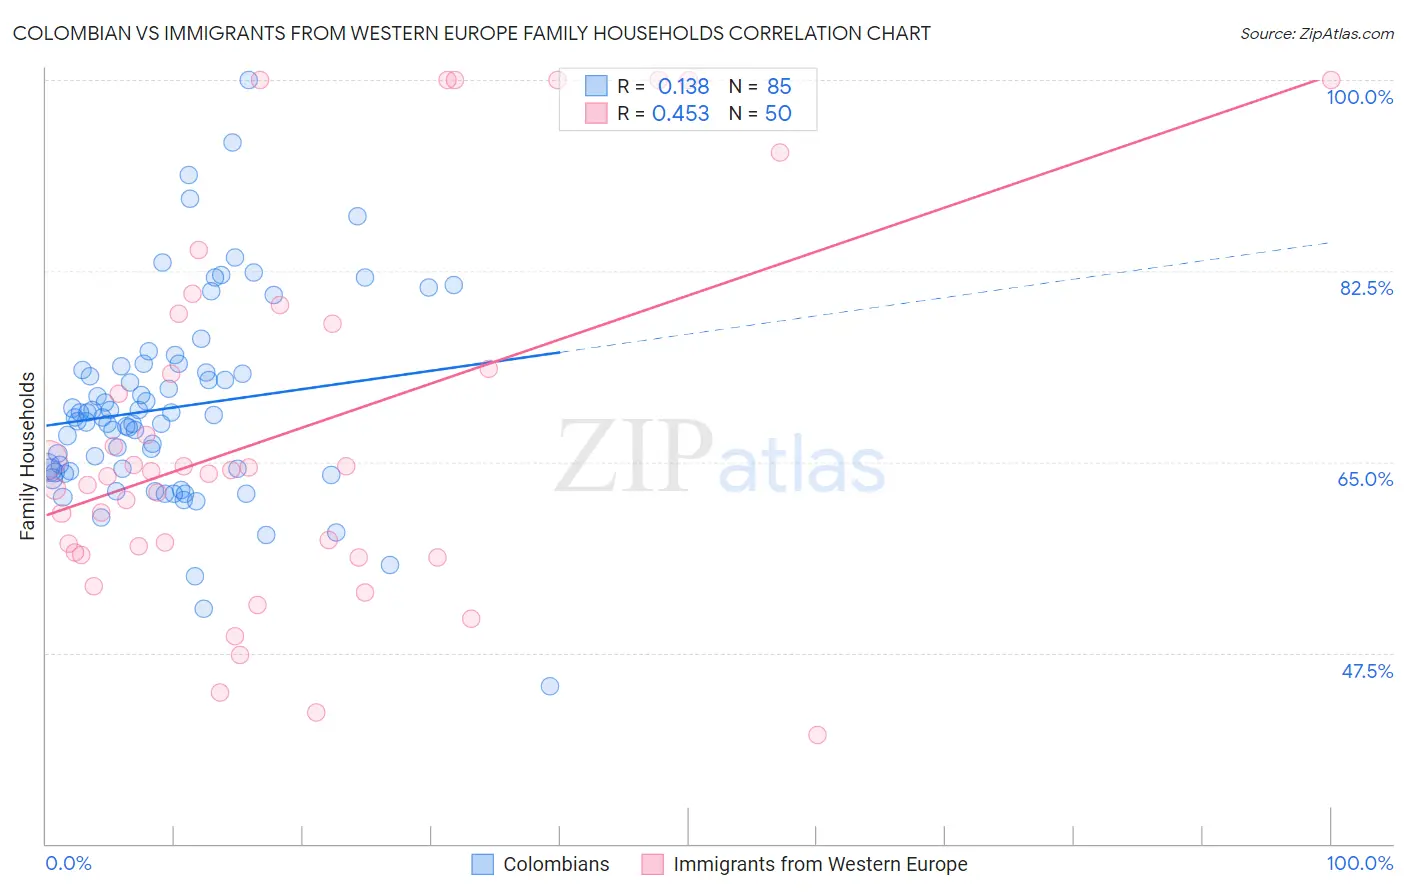
Colombian vs Immigrants from Western Europe Family Households Correlation Chart

The statistical analysis conducted on geographies consisting of 419,324,434 people shows a poor positive correlation between the proportion of Colombians and percentage of family households in the United States with a correlation coefficient (R) of 0.138 and weighted average of 66.3%. Similarly, the statistical analysis conducted on geographies consisting of 493,828,314 people shows a moderate positive correlation between the proportion of Immigrants from Western Europe and percentage of family households in the United States with a correlation coefficient (R) of 0.453 and weighted average of 63.2%, a difference of 4.8%.
Colombian vs Immigrants from Western Europe Family Households

Family Households Correlation Summary

MeasurementColombianImmigrants from Western Europe
Minimum44.4%40.0%
Maximum100.0%100.0%
Range55.6%60.0%
Mean70.0%67.6%
Median69.1%64.0%
Interquartile 25% (IQ1)64.1%56.7%
Interquartile 75% (IQ3)73.6%77.7%
Interquartile Range (IQR)9.5%21.0%
Standard Deviation (Sample)9.2%16.8%
Standard Deviation (Population)9.2%16.6%

Similar Demographics by Family Households

Demographics Similar to Colombians by Family Households

In terms of family households, the demographic groups most similar to Colombians are Afghan (66.3%, a difference of 0.010%), Immigrants from Colombia (66.3%, a difference of 0.010%), Native/Alaskan (66.4%, a difference of 0.14%), Navajo (66.4%, a difference of 0.16%), and Immigrants (66.1%, a difference of 0.17%).
DemographicsRating | RankFamily Households
Venezuelans
100.0
/100
|
#45
Exceptional
66.5%
Arapaho
100.0
/100
|
#46
Exceptional
66.5%
Bolivians
100.0
/100
|
#47
Exceptional
66.5%
Immigrants | Venezuela
100.0
/100
|
#48
Exceptional
66.4%
Immigrants | South Central Asia
100.0
/100
|
#49
Exceptional
66.4%
Navajo
100.0
/100
|
#50
Exceptional
66.4%
Natives/Alaskans
100.0
/100
|
#51
Exceptional
66.4%
Colombians
100.0
/100
|
#52
Exceptional
66.3%
Afghans
100.0
/100
|
#53
Exceptional
66.3%
Immigrants | Colombia
100.0
/100
|
#54
Exceptional
66.3%
Immigrants | Immigrants
100.0
/100
|
#55
Exceptional
66.1%
Immigrants | Hong Kong
100.0
/100
|
#56
Exceptional
66.1%
Pennsylvania Germans
100.0
/100
|
#57
Exceptional
66.1%
Immigrants | Asia
100.0
/100
|
#58
Exceptional
66.1%
Immigrants | Korea
100.0
/100
|
#59
Exceptional
66.0%

Demographics Similar to Immigrants from Western Europe by Family Households

In terms of family households, the demographic groups most similar to Immigrants from Western Europe are Immigrants from Barbados (63.2%, a difference of 0.010%), Cypriot (63.2%, a difference of 0.020%), Immigrants from Russia (63.2%, a difference of 0.040%), Immigrants from Ireland (63.2%, a difference of 0.050%), and Icelander (63.3%, a difference of 0.070%).
DemographicsRating | RankFamily Households
Bahamians
1.1
/100
|
#252
Tragic
63.3%
Immigrants | Dominican Republic
1.0
/100
|
#253
Tragic
63.3%
Slovaks
1.0
/100
|
#254
Tragic
63.3%
Potawatomi
1.0
/100
|
#255
Tragic
63.3%
Luxembourgers
0.9
/100
|
#256
Tragic
63.3%
Icelanders
0.8
/100
|
#257
Tragic
63.3%
Immigrants | Barbados
0.7
/100
|
#258
Tragic
63.2%
Immigrants | Western Europe
0.6
/100
|
#259
Tragic
63.2%
Cypriots
0.6
/100
|
#260
Tragic
63.2%
Immigrants | Russia
0.6
/100
|
#261
Tragic
63.2%
Immigrants | Ireland
0.6
/100
|
#262
Tragic
63.2%
Cheyenne
0.5
/100
|
#263
Tragic
63.2%
Kenyans
0.5
/100
|
#264
Tragic
63.2%
Colville
0.5
/100
|
#265
Tragic
63.2%
Immigrants | Western Africa
0.5
/100
|
#266
Tragic
63.1%