Chilean vs West Indian Births to Unmarried Women
COMPARE
Chilean
West Indian
Births to Unmarried Women
Births to Unmarried Women Comparison
Chileans
West Indians
30.7%
BIRTHS TO UNMARRIED WOMEN
79.1/ 100
METRIC RATING
148th/ 347
METRIC RANK
37.3%
BIRTHS TO UNMARRIED WOMEN
0.1/ 100
METRIC RATING
279th/ 347
METRIC RANK
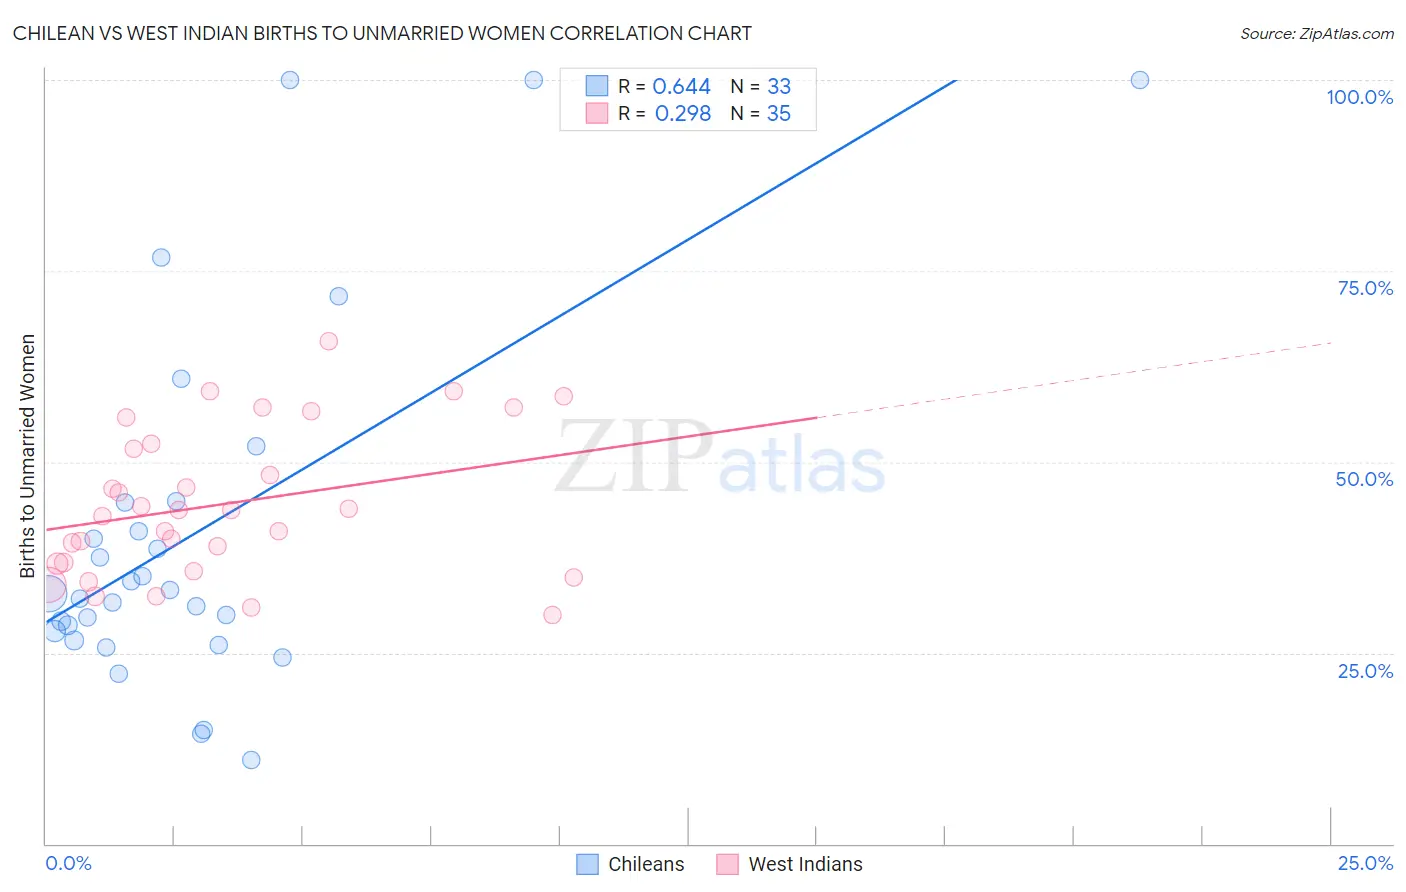
Chilean vs West Indian Births to Unmarried Women Correlation Chart
The statistical analysis conducted on geographies consisting of 245,289,700 people shows a significant positive correlation between the proportion of Chileans and percentage of births to unmarried women in the United States with a correlation coefficient (R) of 0.644 and weighted average of 30.7%. Similarly, the statistical analysis conducted on geographies consisting of 244,812,530 people shows a weak positive correlation between the proportion of West Indians and percentage of births to unmarried women in the United States with a correlation coefficient (R) of 0.298 and weighted average of 37.3%, a difference of 21.5%.
Births to Unmarried Women Correlation Summary
| Measurement | Chilean | West Indian |
| Minimum | 10.9% | 30.0% |
| Maximum | 100.0% | 65.8% |
| Range | 89.1% | 35.8% |
| Mean | 40.9% | 44.5% |
| Median | 32.7% | 43.7% |
| Interquartile 25% (IQ1) | 27.2% | 36.7% |
| Interquartile 75% (IQ3) | 44.8% | 52.4% |
| Interquartile Range (IQR) | 17.5% | 15.7% |
| Standard Deviation (Sample) | 23.7% | 9.6% |
| Standard Deviation (Population) | 23.4% | 9.5% |
Similar Demographics by Births to Unmarried Women
Demographics Similar to Chileans by Births to Unmarried Women
In terms of births to unmarried women, the demographic groups most similar to Chileans are Serbian (30.7%, a difference of 0.040%), Somali (30.7%, a difference of 0.19%), Italian (30.8%, a difference of 0.30%), Immigrants from Oceania (30.6%, a difference of 0.33%), and Northern European (30.6%, a difference of 0.36%).
| Demographics | Rating | Rank | Births to Unmarried Women |
| Pakistanis | 83.0 /100 | #141 | Excellent 30.5% |
| South Africans | 82.7 /100 | #142 | Excellent 30.5% |
| Immigrants | Uganda | 82.6 /100 | #143 | Excellent 30.5% |
| Czechs | 82.1 /100 | #144 | Excellent 30.5% |
| Immigrants | North America | 81.5 /100 | #145 | Excellent 30.6% |
| Northern Europeans | 81.4 /100 | #146 | Excellent 30.6% |
| Immigrants | Oceania | 81.2 /100 | #147 | Excellent 30.6% |
| Chileans | 79.1 /100 | #148 | Good 30.7% |
| Serbians | 78.8 /100 | #149 | Good 30.7% |
| Somalis | 77.8 /100 | #150 | Good 30.7% |
| Italians | 77.0 /100 | #151 | Good 30.8% |
| Poles | 76.2 /100 | #152 | Good 30.8% |
| British | 76.0 /100 | #153 | Good 30.8% |
| Yugoslavians | 75.1 /100 | #154 | Good 30.8% |
| Immigrants | Bangladesh | 73.9 /100 | #155 | Good 30.9% |
Demographics Similar to West Indians by Births to Unmarried Women
In terms of births to unmarried women, the demographic groups most similar to West Indians are Immigrants from St. Vincent and the Grenadines (37.3%, a difference of 0.12%), Immigrants from Belize (37.3%, a difference of 0.13%), Liberian (37.4%, a difference of 0.30%), Immigrants from Latin America (37.1%, a difference of 0.33%), and Spanish American Indian (37.4%, a difference of 0.38%).
| Demographics | Rating | Rank | Births to Unmarried Women |
| Choctaw | 0.1 /100 | #272 | Tragic 36.9% |
| Mexicans | 0.1 /100 | #273 | Tragic 36.9% |
| Cree | 0.1 /100 | #274 | Tragic 37.0% |
| Barbadians | 0.1 /100 | #275 | Tragic 37.0% |
| Belizeans | 0.1 /100 | #276 | Tragic 37.0% |
| Guatemalans | 0.1 /100 | #277 | Tragic 37.1% |
| Immigrants | Latin America | 0.1 /100 | #278 | Tragic 37.1% |
| West Indians | 0.1 /100 | #279 | Tragic 37.3% |
| Immigrants | St. Vincent and the Grenadines | 0.1 /100 | #280 | Tragic 37.3% |
| Immigrants | Belize | 0.1 /100 | #281 | Tragic 37.3% |
| Liberians | 0.0 /100 | #282 | Tragic 37.4% |
| Spanish American Indians | 0.0 /100 | #283 | Tragic 37.4% |
| Immigrants | Central America | 0.0 /100 | #284 | Tragic 37.4% |
| Immigrants | Mexico | 0.0 /100 | #285 | Tragic 37.5% |
| Immigrants | Guatemala | 0.0 /100 | #286 | Tragic 37.5% |