Chickasaw vs Puget Sound Salish Family Households with Children
COMPARE
Chickasaw
Puget Sound Salish
Family Households with Children
Family Households with Children Comparison
Chickasaw
Puget Sound Salish
28.2%
FAMILY HOUSEHOLDS WITH CHILDREN
99.4/ 100
METRIC RATING
92nd/ 347
METRIC RANK
27.4%
FAMILY HOUSEHOLDS WITH CHILDREN
46.2/ 100
METRIC RATING
182nd/ 347
METRIC RANK
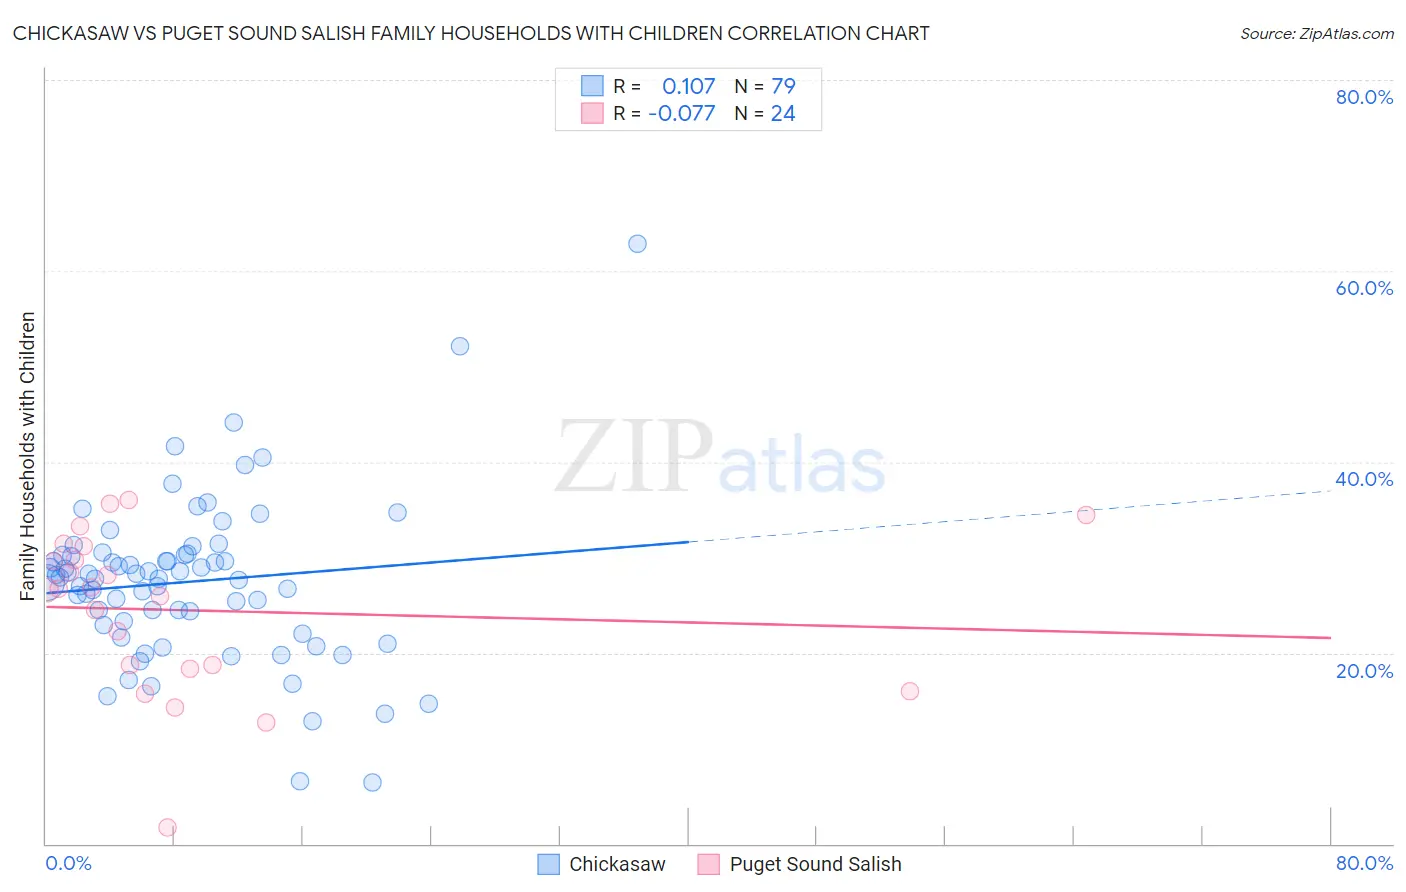
Chickasaw vs Puget Sound Salish Family Households with Children Correlation Chart
The statistical analysis conducted on geographies consisting of 147,673,787 people shows a poor positive correlation between the proportion of Chickasaw and percentage of family households with children in the United States with a correlation coefficient (R) of 0.107 and weighted average of 28.2%. Similarly, the statistical analysis conducted on geographies consisting of 46,155,538 people shows a slight negative correlation between the proportion of Puget Sound Salish and percentage of family households with children in the United States with a correlation coefficient (R) of -0.077 and weighted average of 27.4%, a difference of 2.9%.
Family Households with Children Correlation Summary
| Measurement | Chickasaw | Puget Sound Salish |
| Minimum | 6.5% | 1.6% |
| Maximum | 62.8% | 36.0% |
| Range | 56.3% | 34.3% |
| Mean | 27.4% | 24.4% |
| Median | 27.9% | 26.7% |
| Interquartile 25% (IQ1) | 22.9% | 18.5% |
| Interquartile 75% (IQ3) | 30.3% | 30.4% |
| Interquartile Range (IQR) | 7.4% | 11.9% |
| Standard Deviation (Sample) | 8.6% | 8.5% |
| Standard Deviation (Population) | 8.5% | 8.3% |
Similar Demographics by Family Households with Children
Demographics Similar to Chickasaw by Family Households with Children
In terms of family households with children, the demographic groups most similar to Chickasaw are Immigrants from Liberia (28.2%, a difference of 0.020%), Immigrants from Thailand (28.2%, a difference of 0.070%), Panamanian (28.2%, a difference of 0.11%), Immigrants from Colombia (28.2%, a difference of 0.15%), and Immigrants from Costa Rica (28.3%, a difference of 0.18%).
| Demographics | Rating | Rank | Family Households with Children |
| Immigrants | Syria | 99.8 /100 | #85 | Exceptional 28.4% |
| Immigrants | Western Africa | 99.6 /100 | #86 | Exceptional 28.3% |
| Colombians | 99.6 /100 | #87 | Exceptional 28.3% |
| Liberians | 99.6 /100 | #88 | Exceptional 28.3% |
| Immigrants | Costa Rica | 99.6 /100 | #89 | Exceptional 28.3% |
| Immigrants | Thailand | 99.5 /100 | #90 | Exceptional 28.2% |
| Immigrants | Liberia | 99.4 /100 | #91 | Exceptional 28.2% |
| Chickasaw | 99.4 /100 | #92 | Exceptional 28.2% |
| Panamanians | 99.3 /100 | #93 | Exceptional 28.2% |
| Immigrants | Colombia | 99.2 /100 | #94 | Exceptional 28.2% |
| Immigrants | Nicaragua | 99.1 /100 | #95 | Exceptional 28.2% |
| Ute | 99.1 /100 | #96 | Exceptional 28.2% |
| Chileans | 98.9 /100 | #97 | Exceptional 28.1% |
| Immigrants | Kenya | 98.9 /100 | #98 | Exceptional 28.1% |
| Immigrants | Azores | 98.8 /100 | #99 | Exceptional 28.1% |
Demographics Similar to Puget Sound Salish by Family Households with Children
In terms of family households with children, the demographic groups most similar to Puget Sound Salish are Immigrants from Turkey (27.4%, a difference of 0.010%), Aleut (27.4%, a difference of 0.010%), Turkish (27.4%, a difference of 0.020%), South African (27.4%, a difference of 0.030%), and Native Hawaiian (27.4%, a difference of 0.040%).
| Demographics | Rating | Rank | Family Households with Children |
| British | 49.9 /100 | #175 | Average 27.4% |
| Immigrants | China | 49.6 /100 | #176 | Average 27.4% |
| Ugandans | 49.2 /100 | #177 | Average 27.4% |
| Spanish Americans | 48.9 /100 | #178 | Average 27.4% |
| Turks | 46.9 /100 | #179 | Average 27.4% |
| Immigrants | Turkey | 46.9 /100 | #180 | Average 27.4% |
| Aleuts | 46.7 /100 | #181 | Average 27.4% |
| Puget Sound Salish | 46.2 /100 | #182 | Average 27.4% |
| South Africans | 44.9 /100 | #183 | Average 27.4% |
| Native Hawaiians | 44.6 /100 | #184 | Average 27.4% |
| Delaware | 42.0 /100 | #185 | Average 27.4% |
| Immigrants | Brazil | 40.6 /100 | #186 | Average 27.4% |
| Creek | 39.8 /100 | #187 | Fair 27.4% |
| Dutch | 38.8 /100 | #188 | Fair 27.4% |
| Immigrants | Israel | 37.9 /100 | #189 | Fair 27.4% |