Cherokee vs Costa Rican Divorced or Separated
COMPARE
Cherokee
Costa Rican
Divorced or Separated
Divorced or Separated Comparison
Cherokee
Costa Ricans
13.7%
DIVORCED OR SEPARATED
0.0/ 100
METRIC RATING
332nd/ 347
METRIC RANK
12.0%
DIVORCED OR SEPARATED
53.3/ 100
METRIC RATING
171st/ 347
METRIC RANK
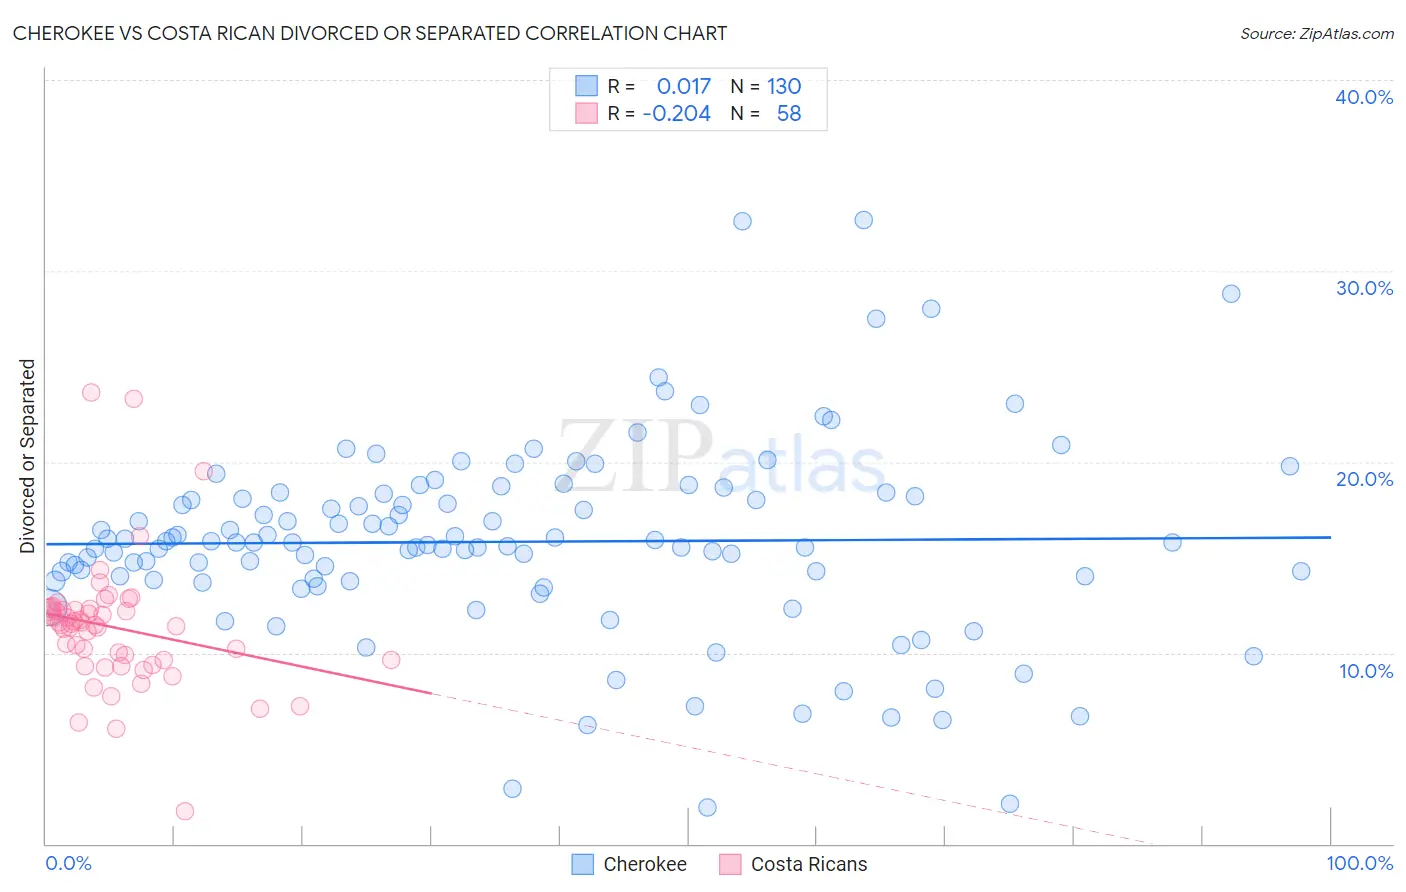
Cherokee vs Costa Rican Divorced or Separated Correlation Chart
The statistical analysis conducted on geographies consisting of 493,555,088 people shows no correlation between the proportion of Cherokee and percentage of population currently divorced or separated in the United States with a correlation coefficient (R) of 0.017 and weighted average of 13.7%. Similarly, the statistical analysis conducted on geographies consisting of 253,501,328 people shows a weak negative correlation between the proportion of Costa Ricans and percentage of population currently divorced or separated in the United States with a correlation coefficient (R) of -0.204 and weighted average of 12.0%, a difference of 14.0%.
Divorced or Separated Correlation Summary
| Measurement | Cherokee | Costa Rican |
| Minimum | 1.9% | 1.7% |
| Maximum | 32.7% | 23.6% |
| Range | 30.8% | 21.9% |
| Mean | 15.8% | 11.3% |
| Median | 15.8% | 11.5% |
| Interquartile 25% (IQ1) | 13.8% | 9.6% |
| Interquartile 75% (IQ3) | 18.2% | 12.2% |
| Interquartile Range (IQR) | 4.4% | 2.6% |
| Standard Deviation (Sample) | 5.1% | 3.4% |
| Standard Deviation (Population) | 5.1% | 3.4% |
Similar Demographics by Divorced or Separated
Demographics Similar to Cherokee by Divorced or Separated
In terms of divorced or separated, the demographic groups most similar to Cherokee are Black/African American (13.6%, a difference of 0.76%), Paiute (13.6%, a difference of 0.89%), Puerto Rican (13.9%, a difference of 0.95%), Houma (13.6%, a difference of 1.0%), and Immigrants from Caribbean (13.6%, a difference of 1.1%).
| Demographics | Rating | Rank | Divorced or Separated |
| Potawatomi | 0.0 /100 | #325 | Tragic 13.5% |
| Immigrants | Congo | 0.0 /100 | #326 | Tragic 13.5% |
| Comanche | 0.0 /100 | #327 | Tragic 13.5% |
| Immigrants | Caribbean | 0.0 /100 | #328 | Tragic 13.6% |
| Houma | 0.0 /100 | #329 | Tragic 13.6% |
| Paiute | 0.0 /100 | #330 | Tragic 13.6% |
| Blacks/African Americans | 0.0 /100 | #331 | Tragic 13.6% |
| Cherokee | 0.0 /100 | #332 | Tragic 13.7% |
| Puerto Ricans | 0.0 /100 | #333 | Tragic 13.9% |
| Immigrants | Bahamas | 0.0 /100 | #334 | Tragic 13.9% |
| Dutch West Indians | 0.0 /100 | #335 | Tragic 14.0% |
| Shoshone | 0.0 /100 | #336 | Tragic 14.0% |
| Crow | 0.0 /100 | #337 | Tragic 14.1% |
| Choctaw | 0.0 /100 | #338 | Tragic 14.1% |
| Colville | 0.0 /100 | #339 | Tragic 14.2% |
Demographics Similar to Costa Ricans by Divorced or Separated
In terms of divorced or separated, the demographic groups most similar to Costa Ricans are Immigrants from Mexico (12.0%, a difference of 0.010%), Mexican American Indian (12.0%, a difference of 0.090%), Immigrants from Moldova (12.1%, a difference of 0.10%), Hawaiian (12.1%, a difference of 0.12%), and Immigrants from Sierra Leone (12.1%, a difference of 0.12%).
| Demographics | Rating | Rank | Divorced or Separated |
| Swiss | 63.6 /100 | #164 | Good 12.0% |
| German Russians | 61.8 /100 | #165 | Good 12.0% |
| Tohono O'odham | 60.4 /100 | #166 | Good 12.0% |
| Ethiopians | 58.5 /100 | #167 | Average 12.0% |
| Serbians | 57.1 /100 | #168 | Average 12.0% |
| Immigrants | Peru | 57.0 /100 | #169 | Average 12.0% |
| Mexican American Indians | 55.8 /100 | #170 | Average 12.0% |
| Costa Ricans | 53.3 /100 | #171 | Average 12.0% |
| Immigrants | Mexico | 53.2 /100 | #172 | Average 12.0% |
| Immigrants | Moldova | 50.4 /100 | #173 | Average 12.1% |
| Hawaiians | 50.0 /100 | #174 | Average 12.1% |
| Immigrants | Sierra Leone | 50.0 /100 | #175 | Average 12.1% |
| Pennsylvania Germans | 48.9 /100 | #176 | Average 12.1% |
| Brazilians | 47.7 /100 | #177 | Average 12.1% |
| Ghanaians | 45.9 /100 | #178 | Average 12.1% |