Central American vs Immigrants from India Family Households
COMPARE
Central American
Immigrants from India
Family Households
Family Households Comparison
Central Americans
Immigrants from India
66.0%
FAMILY HOUSEHOLDS
100.0/ 100
METRIC RATING
62nd/ 347
METRIC RANK
67.4%
FAMILY HOUSEHOLDS
100.0/ 100
METRIC RATING
26th/ 347
METRIC RANK
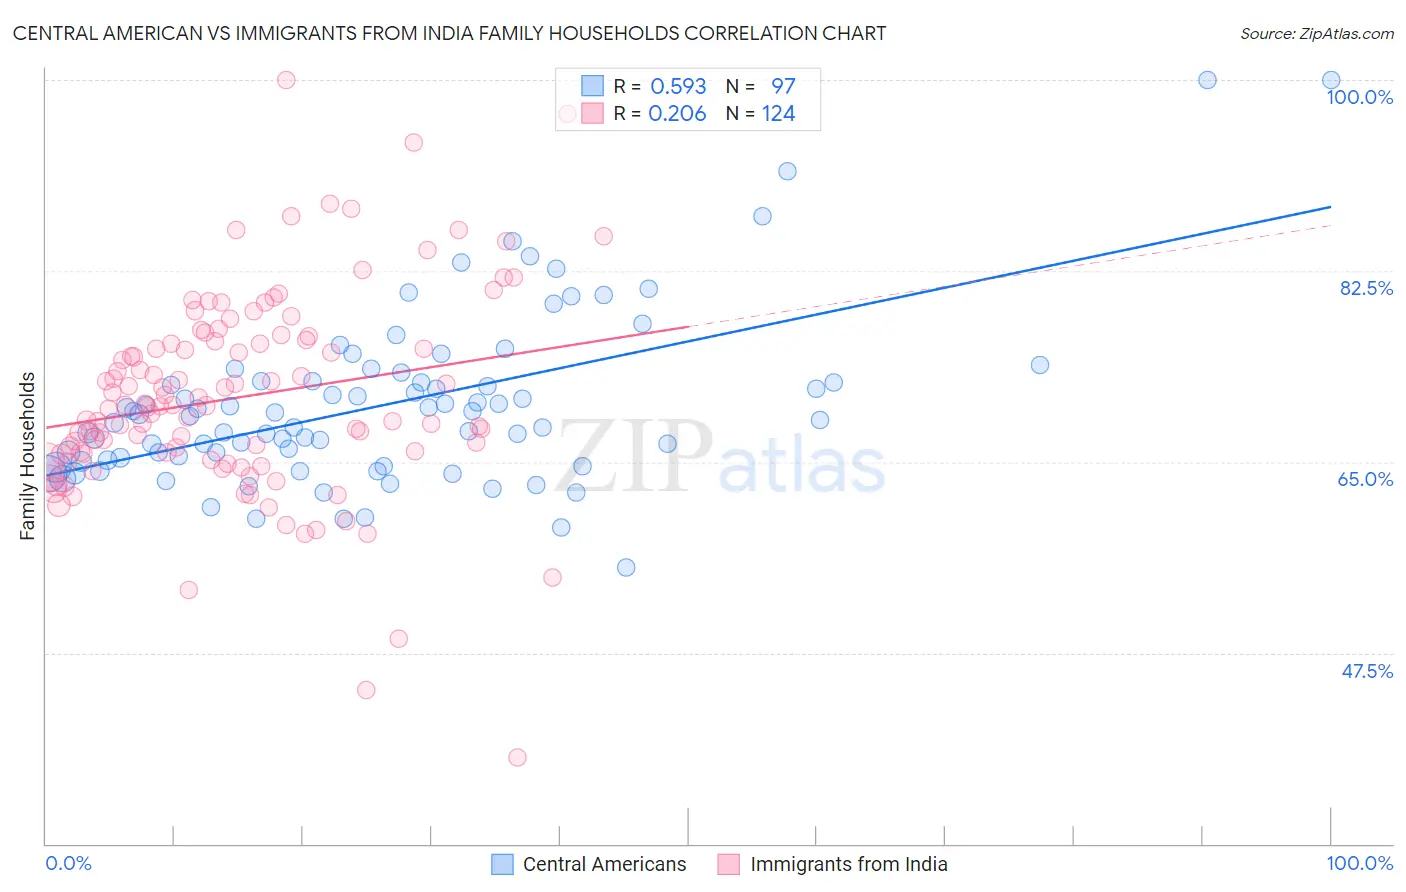
Central American vs Immigrants from India Family Households Correlation Chart
The statistical analysis conducted on geographies consisting of 504,084,166 people shows a substantial positive correlation between the proportion of Central Americans and percentage of family households in the United States with a correlation coefficient (R) of 0.593 and weighted average of 66.0%. Similarly, the statistical analysis conducted on geographies consisting of 433,768,337 people shows a weak positive correlation between the proportion of Immigrants from India and percentage of family households in the United States with a correlation coefficient (R) of 0.206 and weighted average of 67.4%, a difference of 2.2%.
Family Households Correlation Summary
| Measurement | Central American | Immigrants from India |
| Minimum | 55.3% | 37.9% |
| Maximum | 100.0% | 100.0% |
| Range | 44.7% | 62.1% |
| Mean | 70.2% | 70.9% |
| Median | 69.2% | 70.2% |
| Interquartile 25% (IQ1) | 65.1% | 65.7% |
| Interquartile 75% (IQ3) | 72.4% | 76.1% |
| Interquartile Range (IQR) | 7.3% | 10.4% |
| Standard Deviation (Sample) | 7.8% | 9.4% |
| Standard Deviation (Population) | 7.8% | 9.4% |
Similar Demographics by Family Households
Demographics Similar to Central Americans by Family Households
In terms of family households, the demographic groups most similar to Central Americans are Danish (66.0%, a difference of 0.030%), Immigrants from Indonesia (66.0%, a difference of 0.040%), South American (66.0%, a difference of 0.050%), Immigrants from Korea (66.0%, a difference of 0.060%), and Immigrants from Asia (66.1%, a difference of 0.080%).
| Demographics | Rating | Rank | Family Households |
| Immigrants | Immigrants | 100.0 /100 | #55 | Exceptional 66.1% |
| Immigrants | Hong Kong | 100.0 /100 | #56 | Exceptional 66.1% |
| Pennsylvania Germans | 100.0 /100 | #57 | Exceptional 66.1% |
| Immigrants | Asia | 100.0 /100 | #58 | Exceptional 66.1% |
| Immigrants | Korea | 100.0 /100 | #59 | Exceptional 66.0% |
| South Americans | 100.0 /100 | #60 | Exceptional 66.0% |
| Danes | 100.0 /100 | #61 | Exceptional 66.0% |
| Central Americans | 100.0 /100 | #62 | Exceptional 66.0% |
| Immigrants | Indonesia | 100.0 /100 | #63 | Exceptional 66.0% |
| Pima | 99.9 /100 | #64 | Exceptional 65.9% |
| Costa Ricans | 99.9 /100 | #65 | Exceptional 65.9% |
| Fijians | 99.9 /100 | #66 | Exceptional 65.9% |
| Filipinos | 99.9 /100 | #67 | Exceptional 65.9% |
| Japanese | 99.9 /100 | #68 | Exceptional 65.9% |
| Malaysians | 99.9 /100 | #69 | Exceptional 65.9% |
Demographics Similar to Immigrants from India by Family Households
In terms of family households, the demographic groups most similar to Immigrants from India are Immigrants from Nicaragua (67.5%, a difference of 0.010%), Immigrants from South Eastern Asia (67.5%, a difference of 0.040%), Hispanic or Latino (67.4%, a difference of 0.040%), Hawaiian (67.4%, a difference of 0.060%), and Nicaraguan (67.4%, a difference of 0.13%).
| Demographics | Rating | Rank | Family Households |
| Samoans | 100.0 /100 | #19 | Exceptional 67.9% |
| Inupiat | 100.0 /100 | #20 | Exceptional 67.8% |
| Cubans | 100.0 /100 | #21 | Exceptional 67.7% |
| Sri Lankans | 100.0 /100 | #22 | Exceptional 67.7% |
| Immigrants | Pakistan | 100.0 /100 | #23 | Exceptional 67.7% |
| Immigrants | South Eastern Asia | 100.0 /100 | #24 | Exceptional 67.5% |
| Immigrants | Nicaragua | 100.0 /100 | #25 | Exceptional 67.5% |
| Immigrants | India | 100.0 /100 | #26 | Exceptional 67.4% |
| Hispanics or Latinos | 100.0 /100 | #27 | Exceptional 67.4% |
| Hawaiians | 100.0 /100 | #28 | Exceptional 67.4% |
| Nicaraguans | 100.0 /100 | #29 | Exceptional 67.4% |
| Immigrants | Peru | 100.0 /100 | #30 | Exceptional 67.2% |
| Immigrants | Latin America | 100.0 /100 | #31 | Exceptional 67.2% |
| Nepalese | 100.0 /100 | #32 | Exceptional 67.2% |
| Salvadorans | 100.0 /100 | #33 | Exceptional 67.2% |