Carpatho Rusyn vs Immigrants from Israel Family Households with Children
COMPARE
Carpatho Rusyn
Immigrants from Israel
Family Households with Children
Family Households with Children Comparison
Carpatho Rusyns
Immigrants from Israel
25.2%
FAMILY HOUSEHOLDS WITH CHILDREN
0.0/ 100
METRIC RATING
346th/ 347
METRIC RANK
27.4%
FAMILY HOUSEHOLDS WITH CHILDREN
37.9/ 100
METRIC RATING
189th/ 347
METRIC RANK
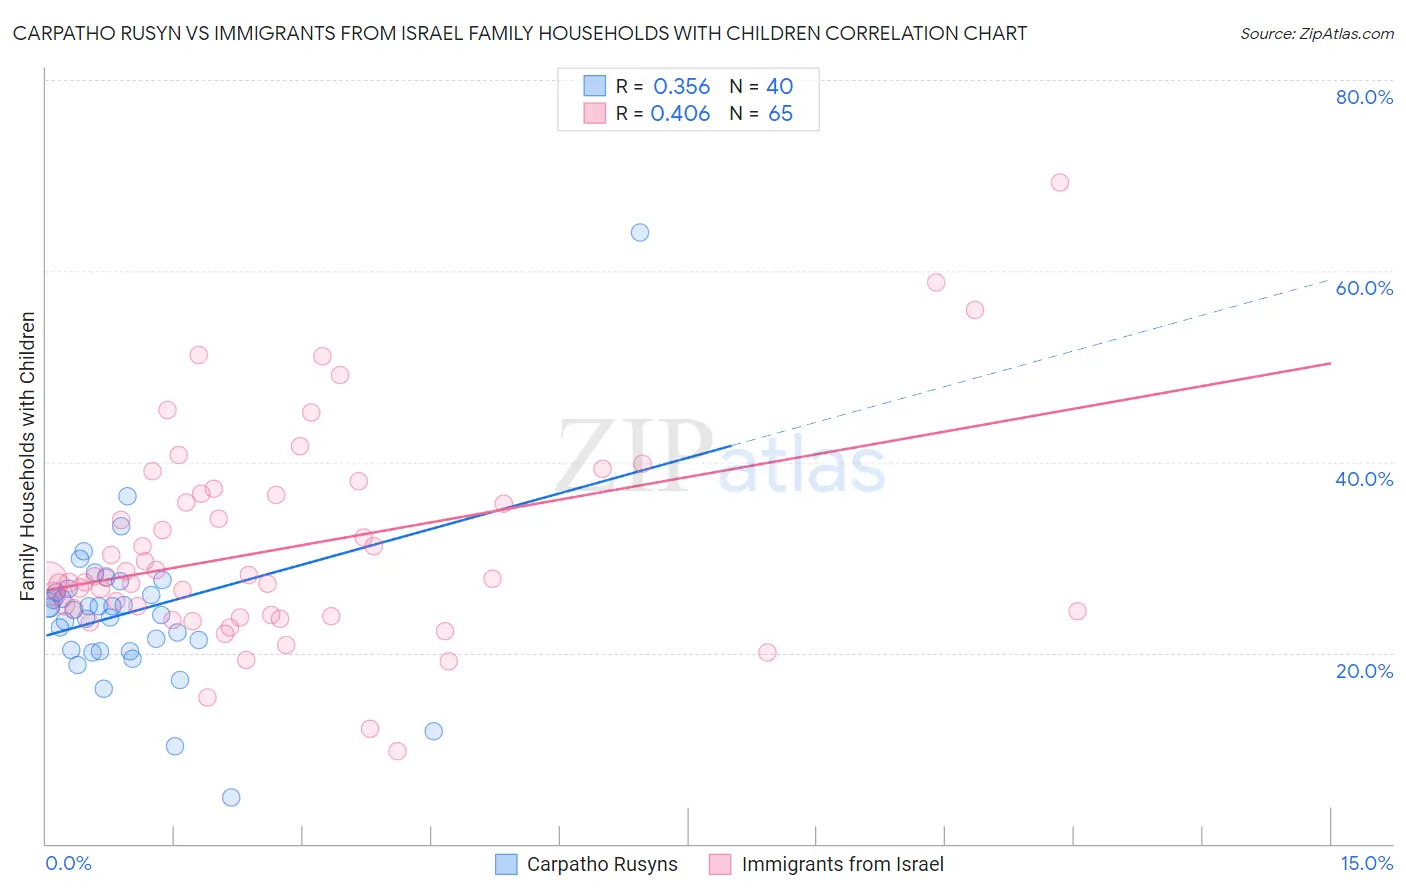
Carpatho Rusyn vs Immigrants from Israel Family Households with Children Correlation Chart
The statistical analysis conducted on geographies consisting of 58,871,401 people shows a mild positive correlation between the proportion of Carpatho Rusyns and percentage of family households with children in the United States with a correlation coefficient (R) of 0.356 and weighted average of 25.2%. Similarly, the statistical analysis conducted on geographies consisting of 209,857,521 people shows a moderate positive correlation between the proportion of Immigrants from Israel and percentage of family households with children in the United States with a correlation coefficient (R) of 0.406 and weighted average of 27.4%, a difference of 8.7%.
Family Households with Children Correlation Summary
| Measurement | Carpatho Rusyn | Immigrants from Israel |
| Minimum | 4.8% | 9.6% |
| Maximum | 64.0% | 69.2% |
| Range | 59.2% | 59.6% |
| Mean | 24.3% | 31.0% |
| Median | 24.6% | 27.7% |
| Interquartile 25% (IQ1) | 20.2% | 23.9% |
| Interquartile 75% (IQ3) | 26.6% | 36.6% |
| Interquartile Range (IQR) | 6.3% | 12.7% |
| Standard Deviation (Sample) | 8.7% | 10.9% |
| Standard Deviation (Population) | 8.6% | 10.8% |
Similar Demographics by Family Households with Children
Demographics Similar to Carpatho Rusyns by Family Households with Children
In terms of family households with children, the demographic groups most similar to Carpatho Rusyns are Immigrants from Grenada (25.2%, a difference of 0.0%), Pueblo (25.2%, a difference of 0.18%), Hopi (25.2%, a difference of 0.29%), Alsatian (25.3%, a difference of 0.44%), and Immigrants from Serbia (25.5%, a difference of 1.1%).
| Demographics | Rating | Rank | Family Households with Children |
| Immigrants | Switzerland | 0.0 /100 | #333 | Tragic 25.7% |
| Slovaks | 0.0 /100 | #334 | Tragic 25.7% |
| Immigrants | Croatia | 0.0 /100 | #335 | Tragic 25.7% |
| Immigrants | West Indies | 0.0 /100 | #336 | Tragic 25.7% |
| Puerto Ricans | 0.0 /100 | #337 | Tragic 25.6% |
| Arapaho | 0.0 /100 | #338 | Tragic 25.6% |
| Immigrants | St. Vincent and the Grenadines | 0.0 /100 | #339 | Tragic 25.6% |
| Immigrants | Armenia | 0.0 /100 | #340 | Tragic 25.6% |
| Immigrants | Serbia | 0.0 /100 | #341 | Tragic 25.5% |
| Alsatians | 0.0 /100 | #342 | Tragic 25.3% |
| Hopi | 0.0 /100 | #343 | Tragic 25.2% |
| Pueblo | 0.0 /100 | #344 | Tragic 25.2% |
| Immigrants | Grenada | 0.0 /100 | #345 | Tragic 25.2% |
| Carpatho Rusyns | 0.0 /100 | #346 | Tragic 25.2% |
| Soviet Union | 0.0 /100 | #347 | Tragic 24.8% |
Demographics Similar to Immigrants from Israel by Family Households with Children
In terms of family households with children, the demographic groups most similar to Immigrants from Israel are Immigrants from Uruguay (27.4%, a difference of 0.010%), Sudanese (27.4%, a difference of 0.010%), Pennsylvania German (27.4%, a difference of 0.010%), Dutch (27.4%, a difference of 0.020%), and Swedish (27.4%, a difference of 0.020%).
| Demographics | Rating | Rank | Family Households with Children |
| Puget Sound Salish | 46.2 /100 | #182 | Average 27.4% |
| South Africans | 44.9 /100 | #183 | Average 27.4% |
| Native Hawaiians | 44.6 /100 | #184 | Average 27.4% |
| Delaware | 42.0 /100 | #185 | Average 27.4% |
| Immigrants | Brazil | 40.6 /100 | #186 | Average 27.4% |
| Creek | 39.8 /100 | #187 | Fair 27.4% |
| Dutch | 38.8 /100 | #188 | Fair 27.4% |
| Immigrants | Israel | 37.9 /100 | #189 | Fair 27.4% |
| Immigrants | Uruguay | 37.7 /100 | #190 | Fair 27.4% |
| Sudanese | 37.6 /100 | #191 | Fair 27.4% |
| Pennsylvania Germans | 37.5 /100 | #192 | Fair 27.4% |
| Swedes | 36.9 /100 | #193 | Fair 27.4% |
| Immigrants | Iran | 36.1 /100 | #194 | Fair 27.4% |
| Crow | 35.7 /100 | #195 | Fair 27.4% |
| Cheyenne | 35.1 /100 | #196 | Fair 27.4% |