British vs Bermudan Births to Unmarried Women
COMPARE
British
Bermudan
Births to Unmarried Women
Births to Unmarried Women Comparison
British
Bermudans
30.8%
BIRTHS TO UNMARRIED WOMEN
76.0/ 100
METRIC RATING
153rd/ 347
METRIC RANK
35.5%
BIRTHS TO UNMARRIED WOMEN
0.6/ 100
METRIC RATING
249th/ 347
METRIC RANK
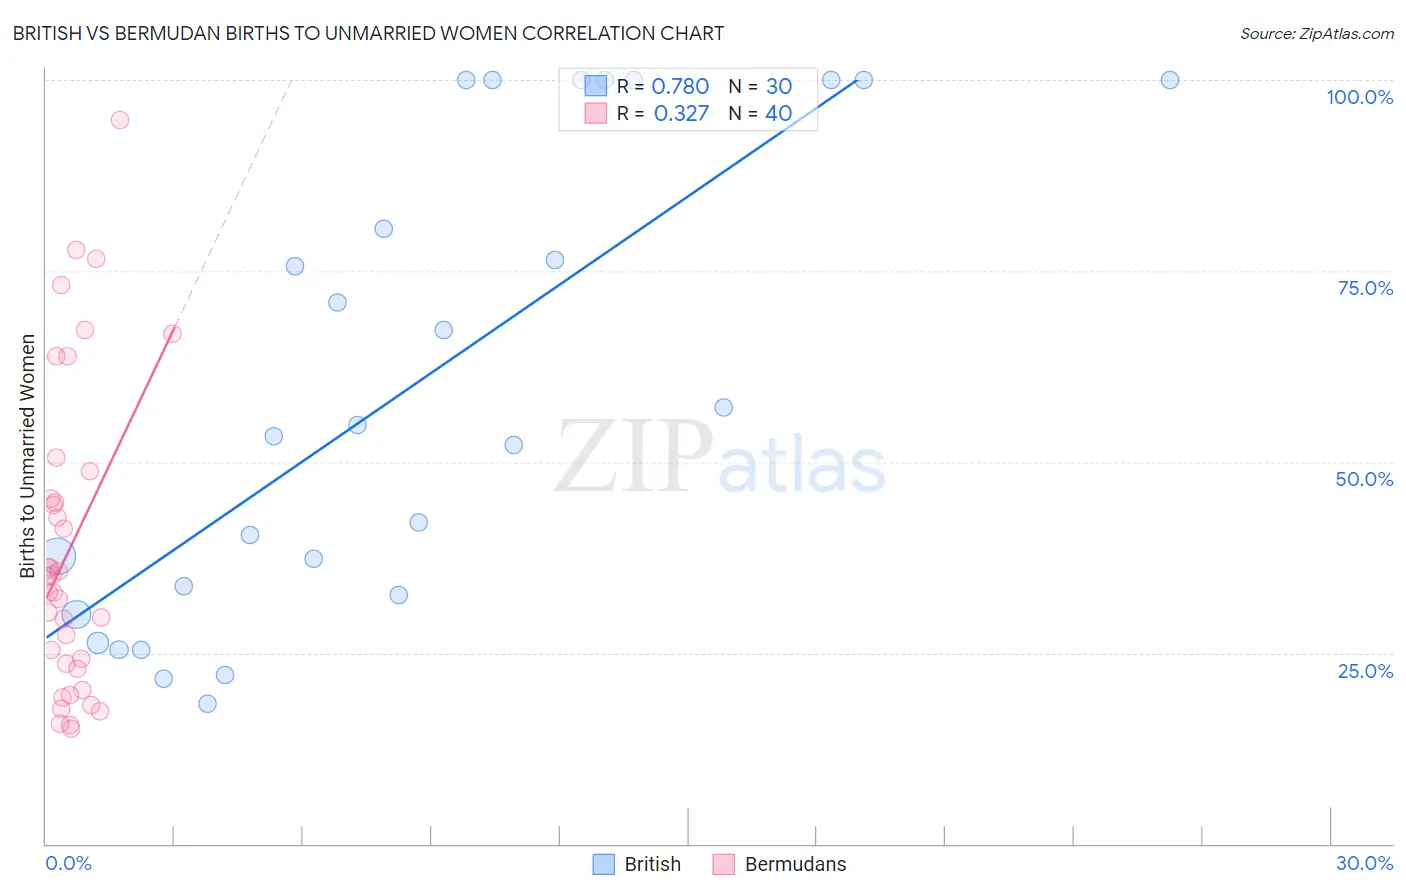
British vs Bermudan Births to Unmarried Women Correlation Chart
The statistical analysis conducted on geographies consisting of 478,658,023 people shows a strong positive correlation between the proportion of British and percentage of births to unmarried women in the United States with a correlation coefficient (R) of 0.780 and weighted average of 30.8%. Similarly, the statistical analysis conducted on geographies consisting of 54,991,721 people shows a mild positive correlation between the proportion of Bermudans and percentage of births to unmarried women in the United States with a correlation coefficient (R) of 0.327 and weighted average of 35.5%, a difference of 15.3%.
Births to Unmarried Women Correlation Summary
| Measurement | British | Bermudan |
| Minimum | 18.3% | 15.1% |
| Maximum | 100.0% | 94.7% |
| Range | 81.7% | 79.6% |
| Mean | 59.4% | 38.7% |
| Median | 54.1% | 34.0% |
| Interquartile 25% (IQ1) | 32.5% | 23.2% |
| Interquartile 75% (IQ3) | 100.0% | 46.9% |
| Interquartile Range (IQR) | 67.5% | 23.7% |
| Standard Deviation (Sample) | 30.1% | 20.2% |
| Standard Deviation (Population) | 29.6% | 20.0% |
Similar Demographics by Births to Unmarried Women
Demographics Similar to British by Births to Unmarried Women
In terms of births to unmarried women, the demographic groups most similar to British are Polish (30.8%, a difference of 0.020%), Yugoslavian (30.8%, a difference of 0.12%), Italian (30.8%, a difference of 0.13%), Somali (30.7%, a difference of 0.24%), and Immigrants from Bangladesh (30.9%, a difference of 0.27%).
| Demographics | Rating | Rank | Births to Unmarried Women |
| Northern Europeans | 81.4 /100 | #146 | Excellent 30.6% |
| Immigrants | Oceania | 81.2 /100 | #147 | Excellent 30.6% |
| Chileans | 79.1 /100 | #148 | Good 30.7% |
| Serbians | 78.8 /100 | #149 | Good 30.7% |
| Somalis | 77.8 /100 | #150 | Good 30.7% |
| Italians | 77.0 /100 | #151 | Good 30.8% |
| Poles | 76.2 /100 | #152 | Good 30.8% |
| British | 76.0 /100 | #153 | Good 30.8% |
| Yugoslavians | 75.1 /100 | #154 | Good 30.8% |
| Immigrants | Bangladesh | 73.9 /100 | #155 | Good 30.9% |
| Carpatho Rusyns | 73.5 /100 | #156 | Good 30.9% |
| Immigrants | Eastern Africa | 72.1 /100 | #157 | Good 31.0% |
| Austrians | 69.9 /100 | #158 | Good 31.0% |
| Immigrants | England | 69.4 /100 | #159 | Good 31.1% |
| Immigrants | Western Europe | 69.3 /100 | #160 | Good 31.1% |
Demographics Similar to Bermudans by Births to Unmarried Women
In terms of births to unmarried women, the demographic groups most similar to Bermudans are Nonimmigrants (35.5%, a difference of 0.010%), Immigrants from Nigeria (35.4%, a difference of 0.34%), Nigerian (35.3%, a difference of 0.55%), Mexican American Indian (35.7%, a difference of 0.61%), and Shoshone (35.3%, a difference of 0.66%).
| Demographics | Rating | Rank | Births to Unmarried Women |
| Indonesians | 1.2 /100 | #242 | Tragic 35.0% |
| Japanese | 0.9 /100 | #243 | Tragic 35.2% |
| Guyanese | 0.9 /100 | #244 | Tragic 35.2% |
| Shoshone | 0.8 /100 | #245 | Tragic 35.3% |
| Nigerians | 0.7 /100 | #246 | Tragic 35.3% |
| Immigrants | Nigeria | 0.7 /100 | #247 | Tragic 35.4% |
| Immigrants | Nonimmigrants | 0.6 /100 | #248 | Tragic 35.5% |
| Bermudans | 0.6 /100 | #249 | Tragic 35.5% |
| Mexican American Indians | 0.4 /100 | #250 | Tragic 35.7% |
| Immigrants | Western Africa | 0.3 /100 | #251 | Tragic 36.0% |
| Salvadorans | 0.3 /100 | #252 | Tragic 36.0% |
| Immigrants | Portugal | 0.2 /100 | #253 | Tragic 36.2% |
| Potawatomi | 0.2 /100 | #254 | Tragic 36.2% |
| Chickasaw | 0.2 /100 | #255 | Tragic 36.3% |
| Immigrants | Trinidad and Tobago | 0.2 /100 | #256 | Tragic 36.3% |