Brazilian vs Vietnamese Average Family Size
COMPARE
Brazilian
Vietnamese
Average Family Size
Average Family Size Comparison
Brazilians
Vietnamese
3.18
AVERAGE FAMILY SIZE
4.5/ 100
METRIC RATING
233rd/ 347
METRIC RANK
3.37
AVERAGE FAMILY SIZE
100.0/ 100
METRIC RATING
47th/ 347
METRIC RANK
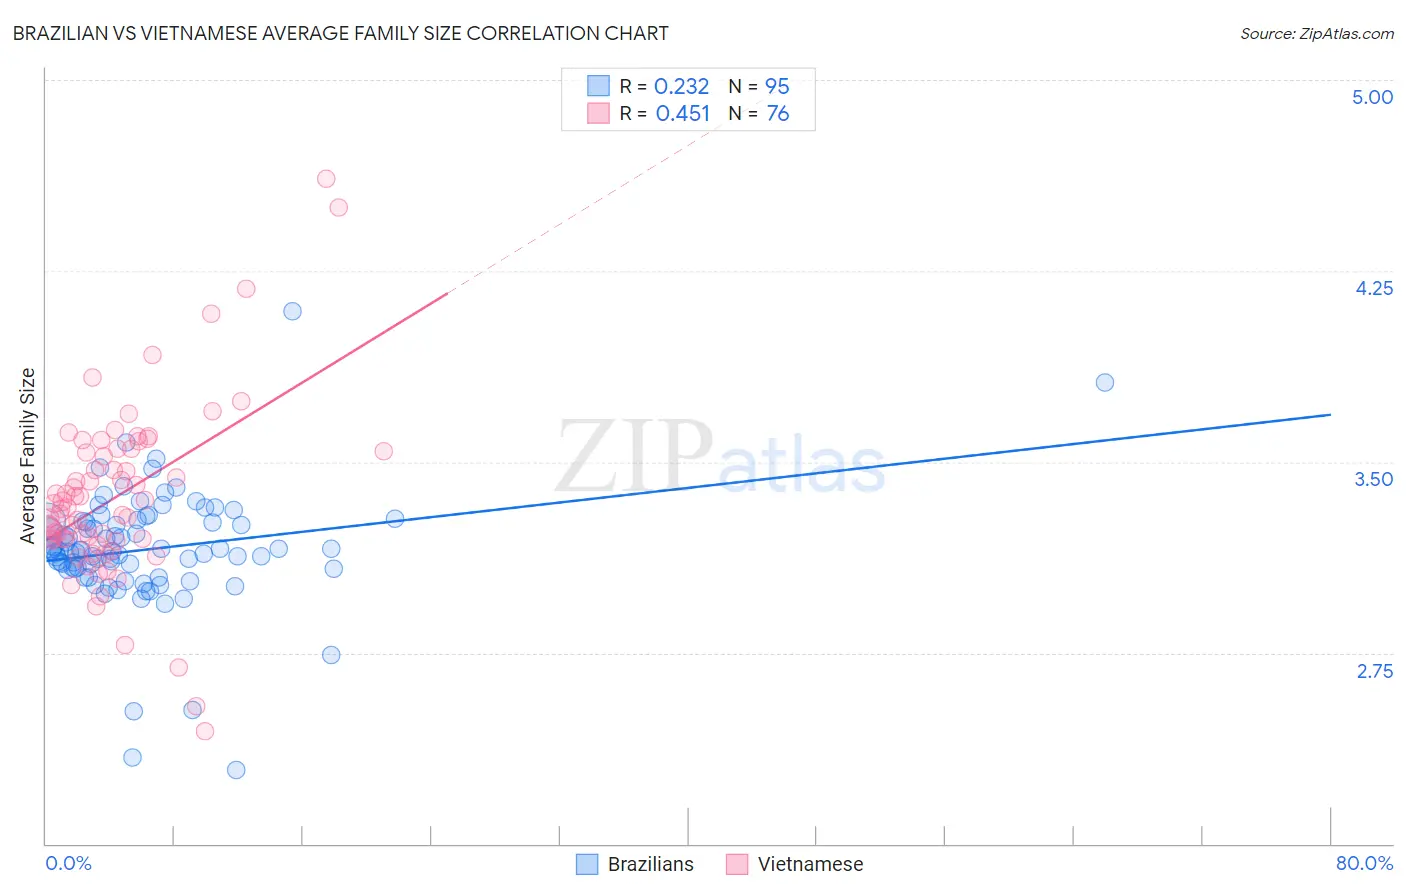
Brazilian vs Vietnamese Average Family Size Correlation Chart
The statistical analysis conducted on geographies consisting of 323,732,012 people shows a weak positive correlation between the proportion of Brazilians and average family size in the United States with a correlation coefficient (R) of 0.232 and weighted average of 3.18. Similarly, the statistical analysis conducted on geographies consisting of 170,658,830 people shows a moderate positive correlation between the proportion of Vietnamese and average family size in the United States with a correlation coefficient (R) of 0.451 and weighted average of 3.37, a difference of 5.9%.
Average Family Size Correlation Summary
| Measurement | Brazilian | Vietnamese |
| Minimum | 2.29 | 2.44 |
| Maximum | 4.09 | 4.61 |
| Range | 1.80 | 2.17 |
| Mean | 3.16 | 3.36 |
| Median | 3.15 | 3.33 |
| Interquartile 25% (IQ1) | 3.08 | 3.20 |
| Interquartile 75% (IQ3) | 3.26 | 3.54 |
| Interquartile Range (IQR) | 0.19 | 0.35 |
| Standard Deviation (Sample) | 0.24 | 0.35 |
| Standard Deviation (Population) | 0.24 | 0.35 |
Similar Demographics by Average Family Size
Demographics Similar to Brazilians by Average Family Size
In terms of average family size, the demographic groups most similar to Brazilians are Iranian (3.18, a difference of 0.0%), Cherokee (3.18, a difference of 0.020%), Immigrants from Turkey (3.18, a difference of 0.030%), Immigrants from Portugal (3.18, a difference of 0.040%), and Icelander (3.19, a difference of 0.070%).
| Demographics | Rating | Rank | Average Family Size |
| Chickasaw | 6.0 /100 | #226 | Tragic 3.19 |
| Portuguese | 6.0 /100 | #227 | Tragic 3.19 |
| Immigrants | Nonimmigrants | 5.7 /100 | #228 | Tragic 3.19 |
| Immigrants | Italy | 5.3 /100 | #229 | Tragic 3.19 |
| Icelanders | 5.2 /100 | #230 | Tragic 3.19 |
| Basques | 5.2 /100 | #231 | Tragic 3.19 |
| Cherokee | 4.7 /100 | #232 | Tragic 3.18 |
| Brazilians | 4.5 /100 | #233 | Tragic 3.18 |
| Iranians | 4.5 /100 | #234 | Tragic 3.18 |
| Immigrants | Turkey | 4.2 /100 | #235 | Tragic 3.18 |
| Immigrants | Portugal | 4.2 /100 | #236 | Tragic 3.18 |
| Immigrants | Romania | 3.7 /100 | #237 | Tragic 3.18 |
| Romanians | 3.7 /100 | #238 | Tragic 3.18 |
| Houma | 3.4 /100 | #239 | Tragic 3.18 |
| Osage | 3.2 /100 | #240 | Tragic 3.18 |
Demographics Similar to Vietnamese by Average Family Size
In terms of average family size, the demographic groups most similar to Vietnamese are Immigrants from Nicaragua (3.37, a difference of 0.0%), Haitian (3.37, a difference of 0.040%), Bangladeshi (3.37, a difference of 0.070%), Shoshone (3.37, a difference of 0.10%), and Alaska Native (3.37, a difference of 0.13%).
| Demographics | Rating | Rank | Average Family Size |
| Belizeans | 100.0 /100 | #40 | Exceptional 3.39 |
| Marshallese | 100.0 /100 | #41 | Exceptional 3.38 |
| Immigrants | Vietnam | 100.0 /100 | #42 | Exceptional 3.38 |
| Immigrants | Philippines | 100.0 /100 | #43 | Exceptional 3.37 |
| Alaska Natives | 100.0 /100 | #44 | Exceptional 3.37 |
| Shoshone | 100.0 /100 | #45 | Exceptional 3.37 |
| Haitians | 100.0 /100 | #46 | Exceptional 3.37 |
| Vietnamese | 100.0 /100 | #47 | Exceptional 3.37 |
| Immigrants | Nicaragua | 100.0 /100 | #48 | Exceptional 3.37 |
| Bangladeshis | 100.0 /100 | #49 | Exceptional 3.37 |
| Immigrants | Bangladesh | 100.0 /100 | #50 | Exceptional 3.36 |
| Nicaraguans | 100.0 /100 | #51 | Exceptional 3.36 |
| Fijians | 100.0 /100 | #52 | Exceptional 3.36 |
| Koreans | 100.0 /100 | #53 | Exceptional 3.36 |
| Immigrants | South Eastern Asia | 100.0 /100 | #54 | Exceptional 3.36 |