Brazilian vs Immigrants from Trinidad and Tobago Divorced or Separated
COMPARE
Brazilian
Immigrants from Trinidad and Tobago
Divorced or Separated
Divorced or Separated Comparison
Brazilians
Immigrants from Trinidad and Tobago
12.1%
DIVORCED OR SEPARATED
47.7/ 100
METRIC RATING
177th/ 347
METRIC RANK
12.2%
DIVORCED OR SEPARATED
17.8/ 100
METRIC RATING
209th/ 347
METRIC RANK
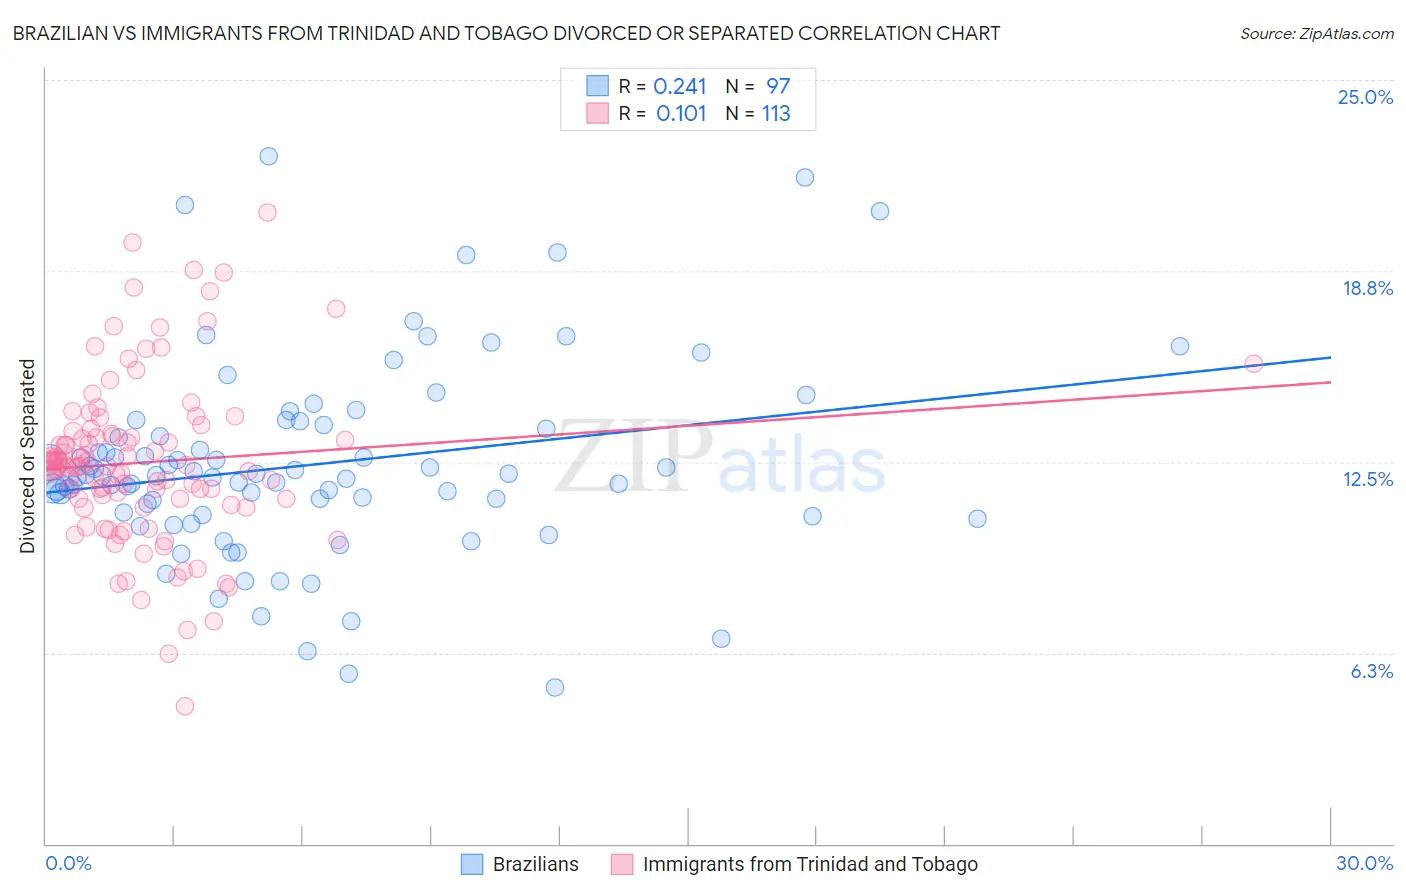
Brazilian vs Immigrants from Trinidad and Tobago Divorced or Separated Correlation Chart
The statistical analysis conducted on geographies consisting of 323,792,537 people shows a weak positive correlation between the proportion of Brazilians and percentage of population currently divorced or separated in the United States with a correlation coefficient (R) of 0.241 and weighted average of 12.1%. Similarly, the statistical analysis conducted on geographies consisting of 223,519,445 people shows a poor positive correlation between the proportion of Immigrants from Trinidad and Tobago and percentage of population currently divorced or separated in the United States with a correlation coefficient (R) of 0.101 and weighted average of 12.2%, a difference of 1.2%.
Divorced or Separated Correlation Summary
| Measurement | Brazilian | Immigrants from Trinidad and Tobago |
| Minimum | 5.1% | 4.5% |
| Maximum | 22.5% | 20.6% |
| Range | 17.4% | 16.1% |
| Mean | 12.4% | 12.5% |
| Median | 12.1% | 12.4% |
| Interquartile 25% (IQ1) | 10.8% | 11.2% |
| Interquartile 75% (IQ3) | 13.6% | 13.5% |
| Interquartile Range (IQR) | 2.8% | 2.3% |
| Standard Deviation (Sample) | 3.2% | 2.7% |
| Standard Deviation (Population) | 3.2% | 2.7% |
Similar Demographics by Divorced or Separated
Demographics Similar to Brazilians by Divorced or Separated
In terms of divorced or separated, the demographic groups most similar to Brazilians are Pennsylvania German (12.1%, a difference of 0.040%), Ghanaian (12.1%, a difference of 0.060%), Hawaiian (12.1%, a difference of 0.080%), Immigrants from Sierra Leone (12.1%, a difference of 0.080%), and Immigrants from Western Europe (12.1%, a difference of 0.080%).
| Demographics | Rating | Rank | Divorced or Separated |
| Mexican American Indians | 55.8 /100 | #170 | Average 12.0% |
| Costa Ricans | 53.3 /100 | #171 | Average 12.0% |
| Immigrants | Mexico | 53.2 /100 | #172 | Average 12.0% |
| Immigrants | Moldova | 50.4 /100 | #173 | Average 12.1% |
| Hawaiians | 50.0 /100 | #174 | Average 12.1% |
| Immigrants | Sierra Leone | 50.0 /100 | #175 | Average 12.1% |
| Pennsylvania Germans | 48.9 /100 | #176 | Average 12.1% |
| Brazilians | 47.7 /100 | #177 | Average 12.1% |
| Ghanaians | 45.9 /100 | #178 | Average 12.1% |
| Immigrants | Western Europe | 45.6 /100 | #179 | Average 12.1% |
| Barbadians | 45.0 /100 | #180 | Average 12.1% |
| Immigrants | Canada | 44.0 /100 | #181 | Average 12.1% |
| Immigrants | Ethiopia | 43.1 /100 | #182 | Average 12.1% |
| Immigrants | Central America | 42.9 /100 | #183 | Average 12.1% |
| Immigrants | North America | 41.1 /100 | #184 | Average 12.1% |
Demographics Similar to Immigrants from Trinidad and Tobago by Divorced or Separated
In terms of divorced or separated, the demographic groups most similar to Immigrants from Trinidad and Tobago are Immigrants from Ghana (12.2%, a difference of 0.050%), Slavic (12.2%, a difference of 0.050%), Trinidadian and Tobagonian (12.2%, a difference of 0.070%), Immigrants from Kenya (12.2%, a difference of 0.080%), and Immigrants from Eastern Africa (12.2%, a difference of 0.10%).
| Demographics | Rating | Rank | Divorced or Separated |
| Portuguese | 23.5 /100 | #202 | Fair 12.2% |
| Immigrants | Guatemala | 23.2 /100 | #203 | Fair 12.2% |
| Kenyans | 21.8 /100 | #204 | Fair 12.2% |
| Immigrants | Costa Rica | 21.3 /100 | #205 | Fair 12.2% |
| Slovaks | 21.0 /100 | #206 | Fair 12.2% |
| Mexicans | 21.0 /100 | #207 | Fair 12.2% |
| Immigrants | Ghana | 18.8 /100 | #208 | Poor 12.2% |
| Immigrants | Trinidad and Tobago | 17.8 /100 | #209 | Poor 12.2% |
| Slavs | 17.0 /100 | #210 | Poor 12.2% |
| Trinidadians and Tobagonians | 16.6 /100 | #211 | Poor 12.2% |
| Immigrants | Kenya | 16.5 /100 | #212 | Poor 12.2% |
| Immigrants | Eastern Africa | 16.2 /100 | #213 | Poor 12.2% |
| Immigrants | Argentina | 15.5 /100 | #214 | Poor 12.2% |
| Europeans | 15.4 /100 | #215 | Poor 12.2% |
| Immigrants | South America | 15.4 /100 | #216 | Poor 12.2% |