Blackfeet vs Immigrants from France Divorced or Separated

COMPARE

Blackfeet
Race
Ancestry
AfghanAfricanAlaska NativeAlaskan AthabascanAlbanianAleutAlsatianAmericanApacheArabArapahoArgentineanArmenianAssyrian/Chaldean/SyriacAustralianAustrianBahamianBangladeshiBarbadianBasqueBelgianBelizeanBermudanBhutaneseBlackfeetBolivianBrazilianBritishBritish West IndianBulgarianBurmeseCajunCambodianCanadianCape VerdeanCarpatho RusynCelticCentral AmericanCentral American IndianCherokeeCheyenneChickasawChileanChineseChippewaChoctawColombianColvilleComancheCosta RicanCreeCreekCroatianCrowCubanCypriotCzechCzechoslovakianDanishDelawareDominicanDutchDutch West IndianEastern EuropeanEcuadorianEgyptianEnglishEstonianEthiopianEuropeanFijianFilipinoFinnishFrenchFrench American IndianFrench CanadianGermanGerman RussianGhanaianGreekGuamanian/ChamorroGuatemalanGuyaneseHaitianHmongHonduranHopiHoumaHungarianIcelanderIndian (Asian)IndonesianInupiatIranianIraqiIrishIroquoisIsraeliItalianJamaicanJapaneseJordanianKenyanKiowaKoreanLaotianLatvianLebaneseLiberianLithuanianLumbeeLuxembourgerMacedonianMalaysianMalteseMarshalleseMenomineeMexicanMexican American IndianMongolianMoroccanNative HawaiianNavajoNepaleseNew ZealanderNicaraguanNigerianNorthern EuropeanNorwegianOkinawanOsageOttawaPaiutePakistaniPalestinianPanamanianParaguayanPennsylvania GermanPeruvianPimaPolishPortuguesePotawatomiPuebloPuerto RicanPuget Sound SalishRomanianRussianSalvadoranSamoanScandinavianScotch-IrishScottishSeminoleSenegaleseSerbianShoshoneSierra LeoneanSiouxSlavicSlovakSloveneSomaliSouth AfricanSouth AmericanSouth American IndianSoviet UnionSpaniardSpanishSpanish AmericanSpanish American IndianSri LankanSubsaharan AfricanSudaneseSwedishSwissSyrianTaiwaneseThaiTlingit-HaidaTohono O'OdhamTonganTrinidadian and TobagonianTsimshianTurkishU.S. Virgin IslanderUgandanUkrainianUruguayanUteVenezuelanVietnameseWelshWest IndianYakamaYaquiYugoslavianYumanYup'ikZimbabwean
Immigration
NonimmigrantsImmigrantsAfghanistanAfricaAlbaniaArgentinaArmeniaAsiaAustraliaAustriaBahamasBangladeshBarbadosBelarusBelgiumBelizeBoliviaBosnia and HerzegovinaBrazilBulgariaBurma/MyanmarCabo VerdeCambodiaCameroonCanadaCaribbeanCentral AmericaChileChinaColombiaCongoCosta RicaCroatiaCubaCzechoslovakiaDenmarkDominicaDominican RepublicEastern AfricaEastern AsiaEastern EuropeEcuadorEgyptEl SalvadorEnglandEritreaEthiopiaEuropeFijiGermanyGhanaGreeceGrenadaGuatemalaGuyanaHaitiHondurasHong KongHungaryIndiaIndonesiaIranIraqIrelandIsraelItalyJamaicaJapanJordanKazakhstanKenyaKoreaKuwaitLaosLatin AmericaLatviaLebanonLiberiaLithuaniaMalaysiaMexicoMicronesiaMiddle AfricaMoldovaMoroccoNepalNetherlandsNicaraguaNigeriaNorth AmericaNorth MacedoniaNorthern AfricaNorthern EuropeNorwayOceaniaPakistanPanamaPeruPhilippinesPolandPortugalRomaniaRussiaSaudi ArabiaScotlandSenegalSerbiaSierra LeoneSingaporeSomaliaSouth AfricaSouth AmericaSouth Central AsiaSouth Eastern AsiaSouthern EuropeSpainSri LankaSt. Vincent and the GrenadinesSudanSwedenSwitzerlandSyriaTaiwanThailandTrinidad and TobagoTurkeyUgandaUkraineUruguayUzbekistanVenezuelaVietnamWest IndiesWestern AfricaWestern AsiaWestern EuropeYemenZaireZimbabweAzores
Immigrants from France
Race
Ancestry
AfghanAfricanAlaska NativeAlaskan AthabascanAlbanianAleutAlsatianAmericanApacheArabArapahoArgentineanArmenianAssyrian/Chaldean/SyriacAustralianAustrianBahamianBangladeshiBarbadianBasqueBelgianBelizeanBermudanBhutaneseBolivianBrazilianBritishBritish West IndianBulgarianBurmeseCajunCambodianCanadianCape VerdeanCarpatho RusynCelticCentral AmericanCentral American IndianCherokeeCheyenneChickasawChileanChineseChippewaChoctawColombianColvilleComancheCosta RicanCreeCreekCroatianCrowCubanCypriotCzechCzechoslovakianDanishDelawareDominicanDutchDutch West IndianEastern EuropeanEcuadorianEgyptianEnglishEstonianEthiopianEuropeanFijianFilipinoFinnishFrenchFrench American IndianFrench CanadianGermanGerman RussianGhanaianGreekGuamanian/ChamorroGuatemalanGuyaneseHaitianHmongHonduranHopiHoumaHungarianIcelanderIndian (Asian)IndonesianInupiatIranianIraqiIrishIroquoisIsraeliItalianJamaicanJapaneseJordanianKenyanKiowaKoreanLaotianLatvianLebaneseLiberianLithuanianLumbeeLuxembourgerMacedonianMalaysianMalteseMarshalleseMenomineeMexicanMexican American IndianMongolianMoroccanNative HawaiianNavajoNepaleseNew ZealanderNicaraguanNigerianNorthern EuropeanNorwegianOkinawanOsageOttawaPaiutePakistaniPalestinianPanamanianParaguayanPennsylvania GermanPeruvianPimaPolishPortuguesePotawatomiPuebloPuerto RicanPuget Sound SalishRomanianRussianSalvadoranSamoanScandinavianScotch-IrishScottishSeminoleSenegaleseSerbianShoshoneSierra LeoneanSiouxSlavicSlovakSloveneSomaliSouth AfricanSouth AmericanSouth American IndianSoviet UnionSpaniardSpanishSpanish AmericanSpanish American IndianSri LankanSubsaharan AfricanSudaneseSwedishSwissSyrianTaiwaneseThaiTlingit-HaidaTohono O'OdhamTonganTrinidadian and TobagonianTsimshianTurkishU.S. Virgin IslanderUgandanUkrainianUruguayanUteVenezuelanVietnameseWelshWest IndianYakamaYaquiYugoslavianYumanYup'ikZimbabwean
Immigration
NonimmigrantsImmigrantsAfghanistanAfricaAlbaniaArgentinaArmeniaAsiaAustraliaAustriaBahamasBangladeshBarbadosBelarusBelgiumBelizeBoliviaBosnia and HerzegovinaBrazilBulgariaBurma/MyanmarCabo VerdeCambodiaCameroonCanadaCaribbeanCentral AmericaChileChinaColombiaCongoCosta RicaCroatiaCubaCzechoslovakiaDenmarkDominicaDominican RepublicEastern AfricaEastern AsiaEastern EuropeEcuadorEgyptEl SalvadorEnglandEritreaEthiopiaEuropeFijiFranceGermanyGhanaGreeceGrenadaGuatemalaGuyanaHaitiHondurasHong KongHungaryIndiaIndonesiaIranIraqIrelandIsraelItalyJamaicaJapanJordanKazakhstanKenyaKoreaKuwaitLaosLatin AmericaLatviaLebanonLiberiaLithuaniaMalaysiaMexicoMicronesiaMiddle AfricaMoldovaMoroccoNepalNetherlandsNicaraguaNigeriaNorth AmericaNorth MacedoniaNorthern AfricaNorthern EuropeNorwayOceaniaPakistanPanamaPeruPhilippinesPolandPortugalRomaniaRussiaSaudi ArabiaScotlandSenegalSerbiaSierra LeoneSingaporeSomaliaSouth AfricaSouth AmericaSouth Central AsiaSouth Eastern AsiaSouthern EuropeSpainSri LankaSt. Vincent and the GrenadinesSudanSwedenSwitzerlandSyriaTaiwanThailandTrinidad and TobagoTurkeyUgandaUkraineUruguayUzbekistanVenezuelaVietnamWest IndiesWestern AfricaWestern AsiaWestern EuropeYemenZaireZimbabweAzores
Divorced or Separated
Income
Poverty
Unemployment
Labor Participation
Family Structure
Vehicle Availability
Education Level
Disability

Divorced or Separated Comparison

Blackfeet

Immigrants from France

Tragic
Exceptional
13.3%
DIVORCED OR SEPARATED
0.0/ 100
METRIC RATING
312th/ 347
METRIC RANK
11.7%
DIVORCED OR SEPARATED
96.6/ 100
METRIC RATING
112th/ 347
METRIC RANK

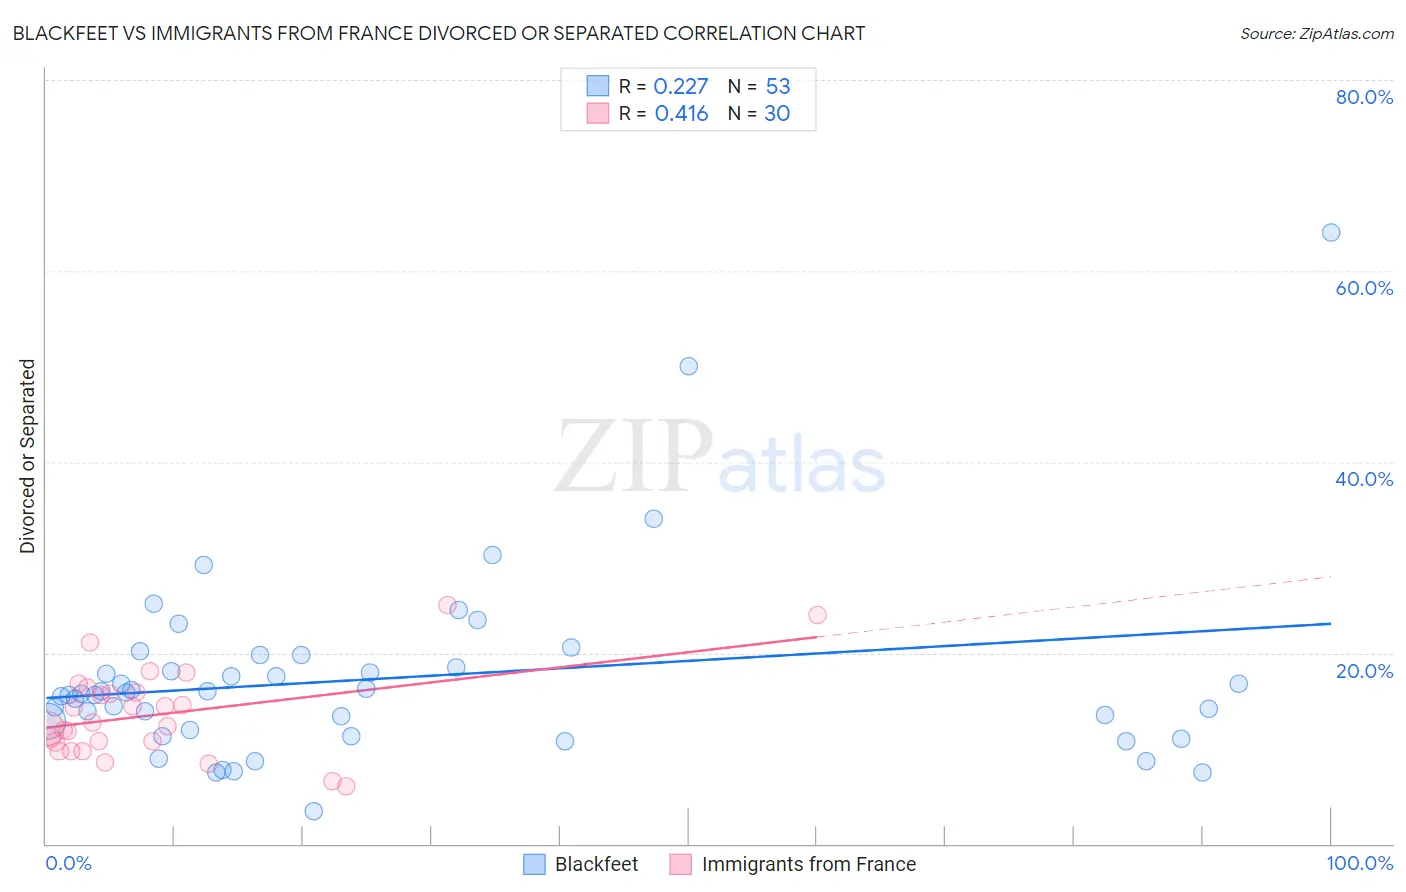
Blackfeet vs Immigrants from France Divorced or Separated Correlation Chart

The statistical analysis conducted on geographies consisting of 309,547,647 people shows a weak positive correlation between the proportion of Blackfeet and percentage of population currently divorced or separated in the United States with a correlation coefficient (R) of 0.227 and weighted average of 13.3%. Similarly, the statistical analysis conducted on geographies consisting of 287,864,701 people shows a moderate positive correlation between the proportion of Immigrants from France and percentage of population currently divorced or separated in the United States with a correlation coefficient (R) of 0.416 and weighted average of 11.7%, a difference of 13.5%.
Blackfeet vs Immigrants from France Divorced or Separated

Divorced or Separated Correlation Summary

MeasurementBlackfeetImmigrants from France
Minimum3.4%6.0%
Maximum64.0%25.0%
Range60.6%19.0%
Mean17.3%13.6%
Median15.7%12.5%
Interquartile 25% (IQ1)11.6%10.7%
Interquartile 75% (IQ3)19.1%15.8%
Interquartile Range (IQR)7.6%5.1%
Standard Deviation (Sample)10.0%4.6%
Standard Deviation (Population)9.9%4.5%

Similar Demographics by Divorced or Separated

Demographics Similar to Blackfeet by Divorced or Separated

In terms of divorced or separated, the demographic groups most similar to Blackfeet are Immigrants from Nicaragua (13.3%, a difference of 0.19%), Yaqui (13.3%, a difference of 0.21%), Sioux (13.2%, a difference of 0.35%), African (13.2%, a difference of 0.37%), and American (13.2%, a difference of 0.39%).
DemographicsRating | RankDivorced or Separated
Chippewa
0.0
/100
|
#305
Tragic
13.2%
Tlingit-Haida
0.0
/100
|
#306
Tragic
13.2%
French American Indians
0.0
/100
|
#307
Tragic
13.2%
Ottawa
0.0
/100
|
#308
Tragic
13.2%
Americans
0.0
/100
|
#309
Tragic
13.2%
Africans
0.0
/100
|
#310
Tragic
13.2%
Sioux
0.0
/100
|
#311
Tragic
13.2%
Blackfeet
0.0
/100
|
#312
Tragic
13.3%
Immigrants | Nicaragua
0.0
/100
|
#313
Tragic
13.3%
Yaqui
0.0
/100
|
#314
Tragic
13.3%
Spanish Americans
0.0
/100
|
#315
Tragic
13.3%
Tsimshian
0.0
/100
|
#316
Tragic
13.3%
Haitians
0.0
/100
|
#317
Tragic
13.3%
Cree
0.0
/100
|
#318
Tragic
13.4%
Puget Sound Salish
0.0
/100
|
#319
Tragic
13.4%

Demographics Similar to Immigrants from France by Divorced or Separated

In terms of divorced or separated, the demographic groups most similar to Immigrants from France are Estonian (11.7%, a difference of 0.0%), Immigrants from Spain (11.7%, a difference of 0.050%), Immigrants from South Africa (11.7%, a difference of 0.090%), Immigrants from Czechoslovakia (11.7%, a difference of 0.090%), and Greek (11.7%, a difference of 0.10%).
DemographicsRating | RankDivorced or Separated
Immigrants | El Salvador
97.9
/100
|
#105
Exceptional
11.7%
Immigrants | Kazakhstan
97.8
/100
|
#106
Exceptional
11.7%
Native Hawaiians
97.2
/100
|
#107
Exceptional
11.7%
Greeks
96.9
/100
|
#108
Exceptional
11.7%
Immigrants | South Africa
96.9
/100
|
#109
Exceptional
11.7%
Immigrants | Czechoslovakia
96.9
/100
|
#110
Exceptional
11.7%
Immigrants | Spain
96.8
/100
|
#111
Exceptional
11.7%
Immigrants | France
96.6
/100
|
#112
Exceptional
11.7%
Estonians
96.6
/100
|
#113
Exceptional
11.7%
Immigrants | Norway
95.9
/100
|
#114
Exceptional
11.7%
Lithuanians
95.7
/100
|
#115
Exceptional
11.7%
Immigrants | Iraq
95.4
/100
|
#116
Exceptional
11.7%
Immigrants | Uganda
95.3
/100
|
#117
Exceptional
11.7%
Ecuadorians
95.3
/100
|
#118
Exceptional
11.7%
Syrians
95.1
/100
|
#119
Exceptional
11.7%