Bermudan vs Immigrants from South America Single Father Households

COMPARE

Bermudan
Race
Ancestry
AfghanAfricanAlaska NativeAlaskan AthabascanAlbanianAleutAlsatianAmericanApacheArabArapahoArgentineanArmenianAssyrian/Chaldean/SyriacAustralianAustrianBahamianBangladeshiBarbadianBasqueBelgianBelizeanBermudanBhutaneseBlackfeetBolivianBrazilianBritishBritish West IndianBulgarianBurmeseCajunCambodianCanadianCape VerdeanCarpatho RusynCelticCentral AmericanCentral American IndianCherokeeCheyenneChickasawChileanChineseChippewaChoctawColombianColvilleComancheCosta RicanCreeCreekCroatianCrowCubanCypriotCzechCzechoslovakianDanishDelawareDominicanDutchDutch West IndianEastern EuropeanEcuadorianEgyptianEnglishEstonianEthiopianEuropeanFijianFilipinoFinnishFrenchFrench American IndianFrench CanadianGermanGerman RussianGhanaianGreekGuamanian/ChamorroGuatemalanGuyaneseHaitianHmongHonduranHopiHoumaHungarianIcelanderIndian (Asian)IndonesianInupiatIranianIraqiIrishIroquoisIsraeliItalianJamaicanJapaneseJordanianKenyanKiowaKoreanLaotianLatvianLebaneseLiberianLithuanianLumbeeLuxembourgerMacedonianMalaysianMalteseMarshalleseMenomineeMexicanMexican American IndianMongolianMoroccanNative HawaiianNavajoNepaleseNew ZealanderNicaraguanNigerianNorthern EuropeanNorwegianOkinawanOsageOttawaPaiutePakistaniPalestinianPanamanianParaguayanPennsylvania GermanPeruvianPimaPolishPortuguesePotawatomiPuebloPuerto RicanPuget Sound SalishRomanianRussianSalvadoranSamoanScandinavianScotch-IrishScottishSeminoleSenegaleseSerbianShoshoneSierra LeoneanSiouxSlavicSlovakSloveneSomaliSouth AfricanSouth AmericanSouth American IndianSoviet UnionSpaniardSpanishSpanish AmericanSpanish American IndianSri LankanSubsaharan AfricanSudaneseSwedishSwissSyrianTaiwaneseThaiTlingit-HaidaTohono O'OdhamTonganTrinidadian and TobagonianTsimshianTurkishU.S. Virgin IslanderUgandanUkrainianUruguayanUteVenezuelanVietnameseWelshWest IndianYakamaYaquiYugoslavianYumanYup'ikZimbabwean
Immigration
NonimmigrantsImmigrantsAfghanistanAfricaAlbaniaArgentinaArmeniaAsiaAustraliaAustriaBahamasBangladeshBarbadosBelarusBelgiumBelizeBoliviaBosnia and HerzegovinaBrazilBulgariaBurma/MyanmarCabo VerdeCambodiaCameroonCanadaCaribbeanCentral AmericaChileChinaColombiaCongoCosta RicaCroatiaCubaCzechoslovakiaDenmarkDominicaDominican RepublicEastern AfricaEastern AsiaEastern EuropeEcuadorEgyptEl SalvadorEnglandEritreaEthiopiaEuropeFijiFranceGermanyGhanaGreeceGrenadaGuatemalaGuyanaHaitiHondurasHong KongHungaryIndiaIndonesiaIranIraqIrelandIsraelItalyJamaicaJapanJordanKazakhstanKenyaKoreaKuwaitLaosLatin AmericaLatviaLebanonLiberiaLithuaniaMalaysiaMexicoMicronesiaMiddle AfricaMoldovaMoroccoNepalNetherlandsNicaraguaNigeriaNorth AmericaNorth MacedoniaNorthern AfricaNorthern EuropeNorwayOceaniaPakistanPanamaPeruPhilippinesPolandPortugalRomaniaRussiaSaudi ArabiaScotlandSenegalSerbiaSierra LeoneSingaporeSomaliaSouth AfricaSouth Central AsiaSouth Eastern AsiaSouthern EuropeSpainSri LankaSt. Vincent and the GrenadinesSudanSwedenSwitzerlandSyriaTaiwanThailandTrinidad and TobagoTurkeyUgandaUkraineUruguayUzbekistanVenezuelaVietnamWest IndiesWestern AfricaWestern AsiaWestern EuropeYemenZaireZimbabweAzores
Immigrants from South America
Race
Ancestry
AfghanAfricanAlaska NativeAlaskan AthabascanAlbanianAleutAlsatianAmericanApacheArabArapahoArgentineanArmenianAssyrian/Chaldean/SyriacAustralianAustrianBahamianBangladeshiBarbadianBasqueBelgianBelizeanBhutaneseBlackfeetBolivianBrazilianBritishBritish West IndianBulgarianBurmeseCajunCambodianCanadianCape VerdeanCarpatho RusynCelticCentral AmericanCentral American IndianCherokeeCheyenneChickasawChileanChineseChippewaChoctawColombianColvilleComancheCosta RicanCreeCreekCroatianCrowCubanCypriotCzechCzechoslovakianDanishDelawareDominicanDutchDutch West IndianEastern EuropeanEcuadorianEgyptianEnglishEstonianEthiopianEuropeanFijianFilipinoFinnishFrenchFrench American IndianFrench CanadianGermanGerman RussianGhanaianGreekGuamanian/ChamorroGuatemalanGuyaneseHaitianHmongHonduranHopiHoumaHungarianIcelanderIndian (Asian)IndonesianInupiatIranianIraqiIrishIroquoisIsraeliItalianJamaicanJapaneseJordanianKenyanKiowaKoreanLaotianLatvianLebaneseLiberianLithuanianLumbeeLuxembourgerMacedonianMalaysianMalteseMarshalleseMenomineeMexicanMexican American IndianMongolianMoroccanNative HawaiianNavajoNepaleseNew ZealanderNicaraguanNigerianNorthern EuropeanNorwegianOkinawanOsageOttawaPaiutePakistaniPalestinianPanamanianParaguayanPennsylvania GermanPeruvianPimaPolishPortuguesePotawatomiPuebloPuerto RicanPuget Sound SalishRomanianRussianSalvadoranSamoanScandinavianScotch-IrishScottishSeminoleSenegaleseSerbianShoshoneSierra LeoneanSiouxSlavicSlovakSloveneSomaliSouth AfricanSouth AmericanSouth American IndianSoviet UnionSpaniardSpanishSpanish AmericanSpanish American IndianSri LankanSubsaharan AfricanSudaneseSwedishSwissSyrianTaiwaneseThaiTlingit-HaidaTohono O'OdhamTonganTrinidadian and TobagonianTsimshianTurkishU.S. Virgin IslanderUgandanUkrainianUruguayanUteVenezuelanVietnameseWelshWest IndianYakamaYaquiYugoslavianYumanYup'ikZimbabwean
Immigration
NonimmigrantsImmigrantsAfghanistanAfricaAlbaniaArgentinaArmeniaAsiaAustraliaAustriaBahamasBangladeshBarbadosBelarusBelgiumBelizeBoliviaBosnia and HerzegovinaBrazilBulgariaBurma/MyanmarCabo VerdeCambodiaCameroonCanadaCaribbeanCentral AmericaChileChinaColombiaCongoCosta RicaCroatiaCubaCzechoslovakiaDenmarkDominicaDominican RepublicEastern AfricaEastern AsiaEastern EuropeEcuadorEgyptEl SalvadorEnglandEritreaEthiopiaEuropeFijiFranceGermanyGhanaGreeceGrenadaGuatemalaGuyanaHaitiHondurasHong KongHungaryIndiaIndonesiaIranIraqIrelandIsraelItalyJamaicaJapanJordanKazakhstanKenyaKoreaKuwaitLaosLatin AmericaLatviaLebanonLiberiaLithuaniaMalaysiaMexicoMicronesiaMiddle AfricaMoldovaMoroccoNepalNetherlandsNicaraguaNigeriaNorth AmericaNorth MacedoniaNorthern AfricaNorthern EuropeNorwayOceaniaPakistanPanamaPeruPhilippinesPolandPortugalRomaniaRussiaSaudi ArabiaScotlandSenegalSerbiaSierra LeoneSingaporeSomaliaSouth AfricaSouth AmericaSouth Central AsiaSouth Eastern AsiaSouthern EuropeSpainSri LankaSt. Vincent and the GrenadinesSudanSwedenSwitzerlandSyriaTaiwanThailandTrinidad and TobagoTurkeyUgandaUkraineUruguayUzbekistanVenezuelaVietnamWest IndiesWestern AfricaWestern AsiaWestern EuropeYemenZaireZimbabweAzores
Single Father Households
Income
Poverty
Unemployment
Labor Participation
Family Structure
Vehicle Availability
Education Level
Disability

Single Father Households Comparison

Bermudans

Immigrants from South America

Exceptional
Good
2.1%
SINGLE FATHER HOUSEHOLDS
99.2/ 100
METRIC RATING
95th/ 347
METRIC RANK
2.3%
SINGLE FATHER HOUSEHOLDS
79.9/ 100
METRIC RATING
156th/ 347
METRIC RANK

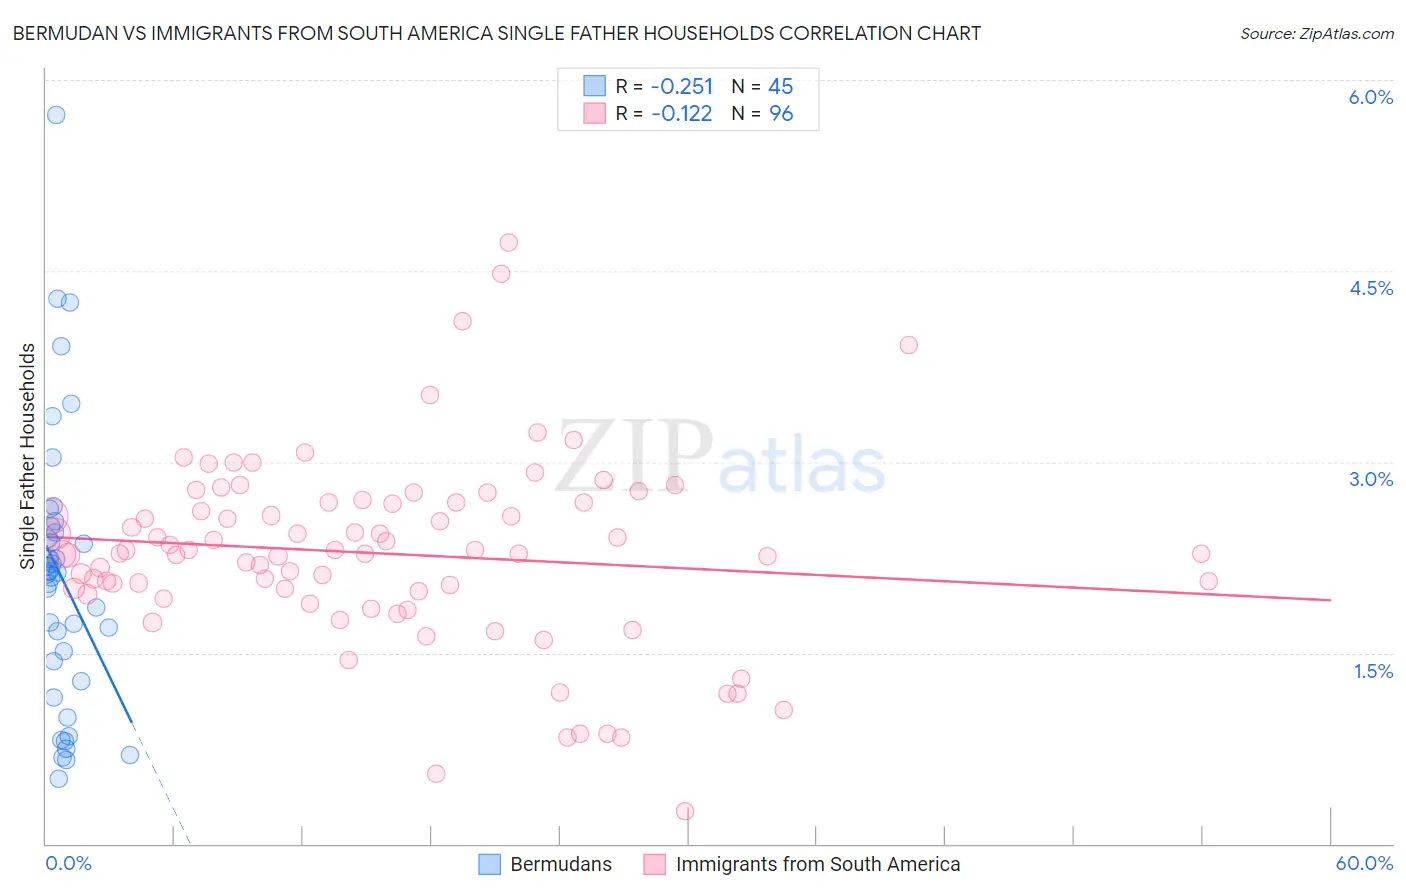
Bermudan vs Immigrants from South America Single Father Households Correlation Chart

The statistical analysis conducted on geographies consisting of 55,647,509 people shows a weak negative correlation between the proportion of Bermudans and percentage of single father households in the United States with a correlation coefficient (R) of -0.251 and weighted average of 2.1%. Similarly, the statistical analysis conducted on geographies consisting of 479,744,076 people shows a poor negative correlation between the proportion of Immigrants from South America and percentage of single father households in the United States with a correlation coefficient (R) of -0.122 and weighted average of 2.3%, a difference of 7.0%.
Bermudan vs Immigrants from South America Single Father Households

Single Father Households Correlation Summary

MeasurementBermudanImmigrants from South America
Minimum0.51%0.26%
Maximum5.7%4.7%
Range5.2%4.5%
Mean2.1%2.3%
Median2.1%2.3%
Interquartile 25% (IQ1)1.4%2.0%
Interquartile 75% (IQ3)2.5%2.7%
Interquartile Range (IQR)1.1%0.71%
Standard Deviation (Sample)1.1%0.75%
Standard Deviation (Population)1.1%0.74%

Similar Demographics by Single Father Households

Demographics Similar to Bermudans by Single Father Households

In terms of single father households, the demographic groups most similar to Bermudans are Arab (2.1%, a difference of 0.14%), Ukrainian (2.1%, a difference of 0.22%), Croatian (2.1%, a difference of 0.23%), Immigrants from Moldova (2.1%, a difference of 0.27%), and Romanian (2.1%, a difference of 0.33%).
DemographicsRating | RankSingle Father Households
Bhutanese
99.5
/100
|
#88
Exceptional
2.1%
Immigrants | Armenia
99.5
/100
|
#89
Exceptional
2.1%
Immigrants | Pakistan
99.5
/100
|
#90
Exceptional
2.1%
Immigrants | Guyana
99.4
/100
|
#91
Exceptional
2.1%
Romanians
99.4
/100
|
#92
Exceptional
2.1%
Croatians
99.3
/100
|
#93
Exceptional
2.1%
Ukrainians
99.3
/100
|
#94
Exceptional
2.1%
Bermudans
99.2
/100
|
#95
Exceptional
2.1%
Arabs
99.2
/100
|
#96
Exceptional
2.1%
Immigrants | Moldova
99.1
/100
|
#97
Exceptional
2.1%
Guyanese
99.1
/100
|
#98
Exceptional
2.1%
South Africans
99.1
/100
|
#99
Exceptional
2.1%
Immigrants | Northern Africa
99.0
/100
|
#100
Exceptional
2.1%
Immigrants | Western Europe
98.9
/100
|
#101
Exceptional
2.1%
Argentineans
98.9
/100
|
#102
Exceptional
2.1%

Demographics Similar to Immigrants from South America by Single Father Households

In terms of single father households, the demographic groups most similar to Immigrants from South America are Canadian (2.3%, a difference of 0.020%), Immigrants from Senegal (2.3%, a difference of 0.050%), European (2.3%, a difference of 0.12%), Bolivian (2.3%, a difference of 0.14%), and Immigrants from West Indies (2.3%, a difference of 0.22%).
DemographicsRating | RankSingle Father Households
Senegalese
88.4
/100
|
#149
Excellent
2.3%
Venezuelans
86.2
/100
|
#150
Excellent
2.3%
Immigrants | Syria
84.8
/100
|
#151
Excellent
2.3%
Immigrants | Venezuela
83.2
/100
|
#152
Excellent
2.3%
Immigrants | Germany
82.8
/100
|
#153
Excellent
2.3%
Bolivians
81.0
/100
|
#154
Excellent
2.3%
Europeans
80.9
/100
|
#155
Excellent
2.3%
Immigrants | South America
79.9
/100
|
#156
Good
2.3%
Canadians
79.7
/100
|
#157
Good
2.3%
Immigrants | Senegal
79.4
/100
|
#158
Good
2.3%
Immigrants | West Indies
77.9
/100
|
#159
Good
2.3%
Immigrants | Bolivia
76.3
/100
|
#160
Good
2.3%
Swiss
73.2
/100
|
#161
Good
2.3%
Scottish
72.8
/100
|
#162
Good
2.3%
Irish
72.1
/100
|
#163
Good
2.3%