Basque vs Czech Currently Married

COMPARE

Basque
Race
Ancestry
AfghanAfricanAlaska NativeAlaskan AthabascanAlbanianAleutAlsatianAmericanApacheArabArapahoArgentineanArmenianAssyrian/Chaldean/SyriacAustralianAustrianBahamianBangladeshiBarbadianBasqueBelgianBelizeanBermudanBhutaneseBlackfeetBolivianBrazilianBritishBritish West IndianBulgarianBurmeseCajunCambodianCanadianCape VerdeanCarpatho RusynCelticCentral AmericanCentral American IndianCherokeeCheyenneChickasawChileanChineseChippewaChoctawColombianColvilleComancheCosta RicanCreeCreekCroatianCrowCubanCypriotCzechoslovakianDanishDelawareDominicanDutchDutch West IndianEastern EuropeanEcuadorianEgyptianEnglishEstonianEthiopianEuropeanFijianFilipinoFinnishFrenchFrench American IndianFrench CanadianGermanGerman RussianGhanaianGreekGuamanian/ChamorroGuatemalanGuyaneseHaitianHmongHonduranHopiHoumaHungarianIcelanderIndian (Asian)IndonesianInupiatIranianIraqiIrishIroquoisIsraeliItalianJamaicanJapaneseJordanianKenyanKiowaKoreanLaotianLatvianLebaneseLiberianLithuanianLumbeeLuxembourgerMacedonianMalaysianMalteseMarshalleseMenomineeMexicanMexican American IndianMongolianMoroccanNative HawaiianNavajoNepaleseNew ZealanderNicaraguanNigerianNorthern EuropeanNorwegianOkinawanOsageOttawaPaiutePakistaniPalestinianPanamanianParaguayanPennsylvania GermanPeruvianPimaPolishPortuguesePotawatomiPuebloPuerto RicanPuget Sound SalishRomanianRussianSalvadoranSamoanScandinavianScotch-IrishScottishSeminoleSenegaleseSerbianShoshoneSierra LeoneanSiouxSlavicSlovakSloveneSomaliSouth AfricanSouth AmericanSouth American IndianSoviet UnionSpaniardSpanishSpanish AmericanSpanish American IndianSri LankanSubsaharan AfricanSudaneseSwedishSwissSyrianTaiwaneseThaiTlingit-HaidaTohono O'OdhamTonganTrinidadian and TobagonianTsimshianTurkishU.S. Virgin IslanderUgandanUkrainianUruguayanUteVenezuelanVietnameseWelshWest IndianYakamaYaquiYugoslavianYumanYup'ikZimbabwean
Immigration
NonimmigrantsImmigrantsAfghanistanAfricaAlbaniaArgentinaArmeniaAsiaAustraliaAustriaBahamasBangladeshBarbadosBelarusBelgiumBelizeBoliviaBosnia and HerzegovinaBrazilBulgariaBurma/MyanmarCabo VerdeCambodiaCameroonCanadaCaribbeanCentral AmericaChileChinaColombiaCongoCosta RicaCroatiaCubaCzechoslovakiaDenmarkDominicaDominican RepublicEastern AfricaEastern AsiaEastern EuropeEcuadorEgyptEl SalvadorEnglandEritreaEthiopiaEuropeFijiFranceGermanyGhanaGreeceGrenadaGuatemalaGuyanaHaitiHondurasHong KongHungaryIndiaIndonesiaIranIraqIrelandIsraelItalyJamaicaJapanJordanKazakhstanKenyaKoreaKuwaitLaosLatin AmericaLatviaLebanonLiberiaLithuaniaMalaysiaMexicoMicronesiaMiddle AfricaMoldovaMoroccoNepalNetherlandsNicaraguaNigeriaNorth AmericaNorth MacedoniaNorthern AfricaNorthern EuropeNorwayOceaniaPakistanPanamaPeruPhilippinesPolandPortugalRomaniaRussiaSaudi ArabiaScotlandSenegalSerbiaSierra LeoneSingaporeSomaliaSouth AfricaSouth AmericaSouth Central AsiaSouth Eastern AsiaSouthern EuropeSpainSri LankaSt. Vincent and the GrenadinesSudanSwedenSwitzerlandSyriaTaiwanThailandTrinidad and TobagoTurkeyUgandaUkraineUruguayUzbekistanVenezuelaVietnamWest IndiesWestern AfricaWestern AsiaWestern EuropeYemenZaireZimbabweAzores
Czech
Race
Ancestry
AfghanAfricanAlaska NativeAlaskan AthabascanAlbanianAleutAlsatianAmericanApacheArabArapahoArgentineanArmenianAssyrian/Chaldean/SyriacAustralianAustrianBahamianBangladeshiBarbadianBelgianBelizeanBermudanBhutaneseBlackfeetBolivianBrazilianBritishBritish West IndianBulgarianBurmeseCajunCambodianCanadianCape VerdeanCarpatho RusynCelticCentral AmericanCentral American IndianCherokeeCheyenneChickasawChileanChineseChippewaChoctawColombianColvilleComancheCosta RicanCreeCreekCroatianCrowCubanCypriotCzechCzechoslovakianDanishDelawareDominicanDutchDutch West IndianEastern EuropeanEcuadorianEgyptianEnglishEstonianEthiopianEuropeanFijianFilipinoFinnishFrenchFrench American IndianFrench CanadianGermanGerman RussianGhanaianGreekGuamanian/ChamorroGuatemalanGuyaneseHaitianHmongHonduranHopiHoumaHungarianIcelanderIndian (Asian)IndonesianInupiatIranianIraqiIrishIroquoisIsraeliItalianJamaicanJapaneseJordanianKenyanKiowaKoreanLaotianLatvianLebaneseLiberianLithuanianLumbeeLuxembourgerMacedonianMalaysianMalteseMarshalleseMenomineeMexicanMexican American IndianMongolianMoroccanNative HawaiianNavajoNepaleseNew ZealanderNicaraguanNigerianNorthern EuropeanNorwegianOkinawanOsageOttawaPaiutePakistaniPalestinianPanamanianParaguayanPennsylvania GermanPeruvianPimaPolishPortuguesePotawatomiPuebloPuerto RicanPuget Sound SalishRomanianRussianSalvadoranSamoanScandinavianScotch-IrishScottishSeminoleSenegaleseSerbianShoshoneSierra LeoneanSiouxSlavicSlovakSloveneSomaliSouth AfricanSouth AmericanSouth American IndianSoviet UnionSpaniardSpanishSpanish AmericanSpanish American IndianSri LankanSubsaharan AfricanSudaneseSwedishSwissSyrianTaiwaneseThaiTlingit-HaidaTohono O'OdhamTonganTrinidadian and TobagonianTsimshianTurkishU.S. Virgin IslanderUgandanUkrainianUruguayanUteVenezuelanVietnameseWelshWest IndianYakamaYaquiYugoslavianYumanYup'ikZimbabwean
Immigration
NonimmigrantsImmigrantsAfghanistanAfricaAlbaniaArgentinaArmeniaAsiaAustraliaAustriaBahamasBangladeshBarbadosBelarusBelgiumBelizeBoliviaBosnia and HerzegovinaBrazilBulgariaBurma/MyanmarCabo VerdeCambodiaCameroonCanadaCaribbeanCentral AmericaChileChinaColombiaCongoCosta RicaCroatiaCubaCzechoslovakiaDenmarkDominicaDominican RepublicEastern AfricaEastern AsiaEastern EuropeEcuadorEgyptEl SalvadorEnglandEritreaEthiopiaEuropeFijiFranceGermanyGhanaGreeceGrenadaGuatemalaGuyanaHaitiHondurasHong KongHungaryIndiaIndonesiaIranIraqIrelandIsraelItalyJamaicaJapanJordanKazakhstanKenyaKoreaKuwaitLaosLatin AmericaLatviaLebanonLiberiaLithuaniaMalaysiaMexicoMicronesiaMiddle AfricaMoldovaMoroccoNepalNetherlandsNicaraguaNigeriaNorth AmericaNorth MacedoniaNorthern AfricaNorthern EuropeNorwayOceaniaPakistanPanamaPeruPhilippinesPolandPortugalRomaniaRussiaSaudi ArabiaScotlandSenegalSerbiaSierra LeoneSingaporeSomaliaSouth AfricaSouth AmericaSouth Central AsiaSouth Eastern AsiaSouthern EuropeSpainSri LankaSt. Vincent and the GrenadinesSudanSwedenSwitzerlandSyriaTaiwanThailandTrinidad and TobagoTurkeyUgandaUkraineUruguayUzbekistanVenezuelaVietnamWest IndiesWestern AfricaWestern AsiaWestern EuropeYemenZaireZimbabweAzores
Currently Married
Income
Poverty
Unemployment
Labor Participation
Family Structure
Vehicle Availability
Education Level
Disability

Currently Married Comparison

Basques

Czechs

Exceptional
Exceptional
48.1%
CURRENTLY MARRIED
97.2/ 100
METRIC RATING
76th/ 347
METRIC RANK
49.9%
CURRENTLY MARRIED
99.9/ 100
METRIC RATING
9th/ 347
METRIC RANK

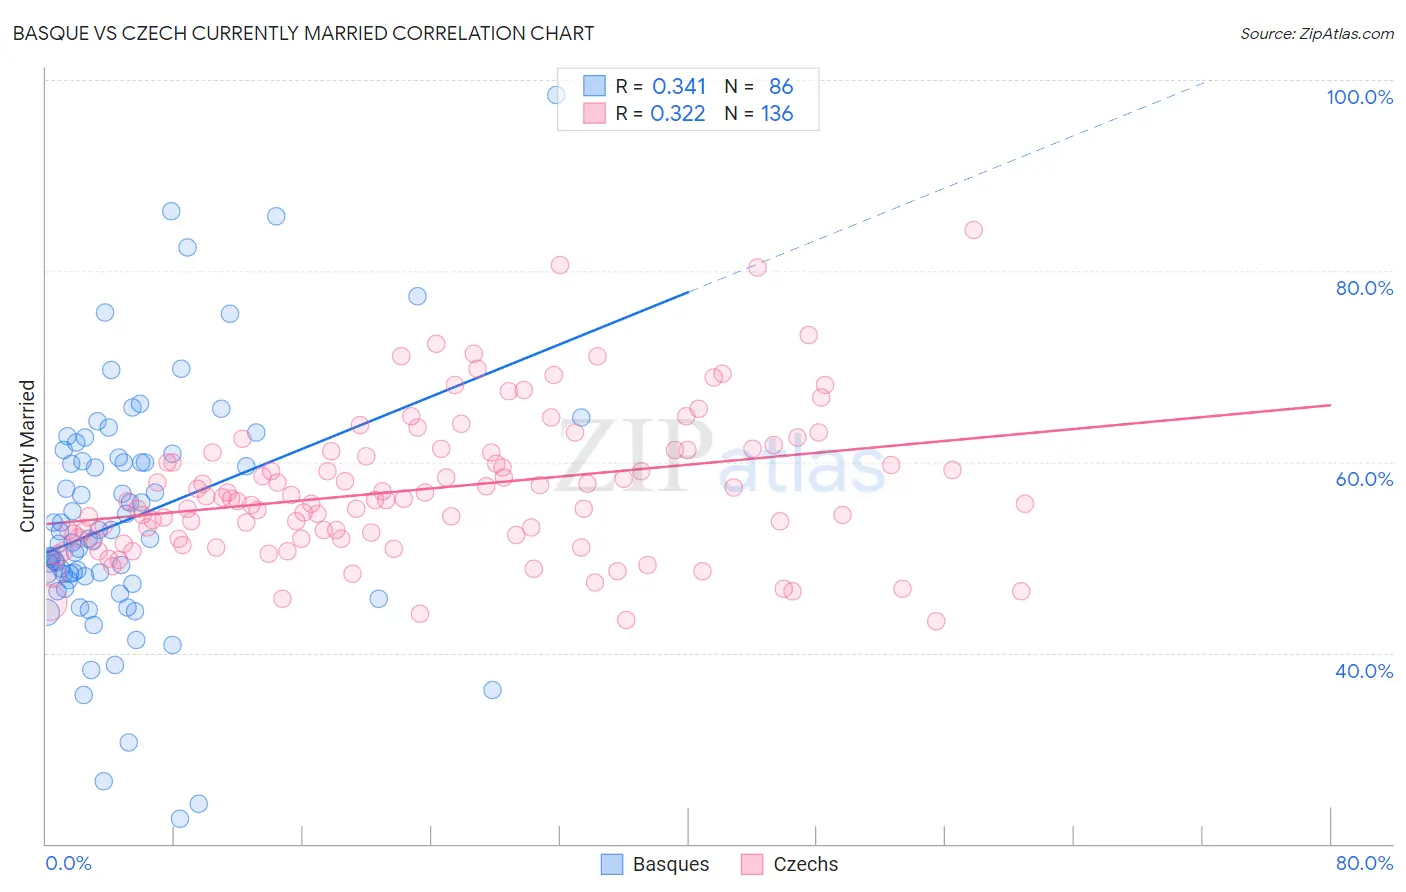
Basque vs Czech Currently Married Correlation Chart

The statistical analysis conducted on geographies consisting of 165,765,037 people shows a mild positive correlation between the proportion of Basques and percentage of population currently married in the United States with a correlation coefficient (R) of 0.341 and weighted average of 48.1%. Similarly, the statistical analysis conducted on geographies consisting of 484,743,369 people shows a mild positive correlation between the proportion of Czechs and percentage of population currently married in the United States with a correlation coefficient (R) of 0.322 and weighted average of 49.9%, a difference of 3.6%.
Basque vs Czech Currently Married

Currently Married Correlation Summary

MeasurementBasqueCzech
Minimum22.6%43.4%
Maximum98.4%84.3%
Range75.8%40.9%
Mean54.1%57.1%
Median52.0%56.0%
Interquartile 25% (IQ1)47.6%52.0%
Interquartile 75% (IQ3)60.5%61.1%
Interquartile Range (IQR)12.9%9.1%
Standard Deviation (Sample)12.9%7.5%
Standard Deviation (Population)12.9%7.5%

Similar Demographics by Currently Married

Demographics Similar to Basques by Currently Married

In terms of currently married, the demographic groups most similar to Basques are Immigrants from Belarus (48.1%, a difference of 0.020%), Slovene (48.1%, a difference of 0.020%), Immigrants from Belgium (48.1%, a difference of 0.030%), Immigrants from South Africa (48.1%, a difference of 0.040%), and Immigrants from Poland (48.1%, a difference of 0.080%).
DemographicsRating | RankCurrently Married
Canadians
98.1
/100
|
#69
Exceptional
48.3%
Immigrants | Asia
97.9
/100
|
#70
Exceptional
48.3%
Macedonians
97.9
/100
|
#71
Exceptional
48.3%
Immigrants | Lebanon
97.6
/100
|
#72
Exceptional
48.2%
Immigrants | Eastern Asia
97.5
/100
|
#73
Exceptional
48.2%
Estonians
97.4
/100
|
#74
Exceptional
48.2%
Immigrants | Belarus
97.2
/100
|
#75
Exceptional
48.1%
Basques
97.2
/100
|
#76
Exceptional
48.1%
Slovenes
97.1
/100
|
#77
Exceptional
48.1%
Immigrants | Belgium
97.1
/100
|
#78
Exceptional
48.1%
Immigrants | South Africa
97.0
/100
|
#79
Exceptional
48.1%
Immigrants | Poland
96.9
/100
|
#80
Exceptional
48.1%
Immigrants | Sri Lanka
96.9
/100
|
#81
Exceptional
48.1%
Immigrants | Europe
96.9
/100
|
#82
Exceptional
48.1%
Bolivians
96.9
/100
|
#83
Exceptional
48.1%

Demographics Similar to Czechs by Currently Married

In terms of currently married, the demographic groups most similar to Czechs are Swedish (50.0%, a difference of 0.19%), Filipino (49.7%, a difference of 0.26%), English (49.7%, a difference of 0.27%), Swiss (49.7%, a difference of 0.27%), and Immigrants from South Central Asia (50.0%, a difference of 0.32%).
DemographicsRating | RankCurrently Married
Thais
100.0
/100
|
#2
Exceptional
50.9%
Assyrians/Chaldeans/Syriacs
100.0
/100
|
#3
Exceptional
50.8%
Immigrants | Taiwan
100.0
/100
|
#4
Exceptional
50.7%
Danes
100.0
/100
|
#5
Exceptional
50.5%
Norwegians
100.0
/100
|
#6
Exceptional
50.2%
Immigrants | South Central Asia
100.0
/100
|
#7
Exceptional
50.0%
Swedes
100.0
/100
|
#8
Exceptional
50.0%
Czechs
99.9
/100
|
#9
Exceptional
49.9%
Filipinos
99.9
/100
|
#10
Exceptional
49.7%
English
99.9
/100
|
#11
Exceptional
49.7%
Swiss
99.9
/100
|
#12
Exceptional
49.7%
Dutch
99.9
/100
|
#13
Exceptional
49.6%
Germans
99.9
/100
|
#14
Exceptional
49.6%
Pennsylvania Germans
99.9
/100
|
#15
Exceptional
49.6%
Chinese
99.9
/100
|
#16
Exceptional
49.5%