Bangladeshi vs Ethiopian Family Households
COMPARE
Bangladeshi
Ethiopian
Family Households
Family Households Comparison
Bangladeshis
Ethiopians
64.3%
FAMILY HOUSEHOLDS
44.3/ 100
METRIC RATING
175th/ 347
METRIC RANK
61.2%
FAMILY HOUSEHOLDS
0.0/ 100
METRIC RATING
332nd/ 347
METRIC RANK
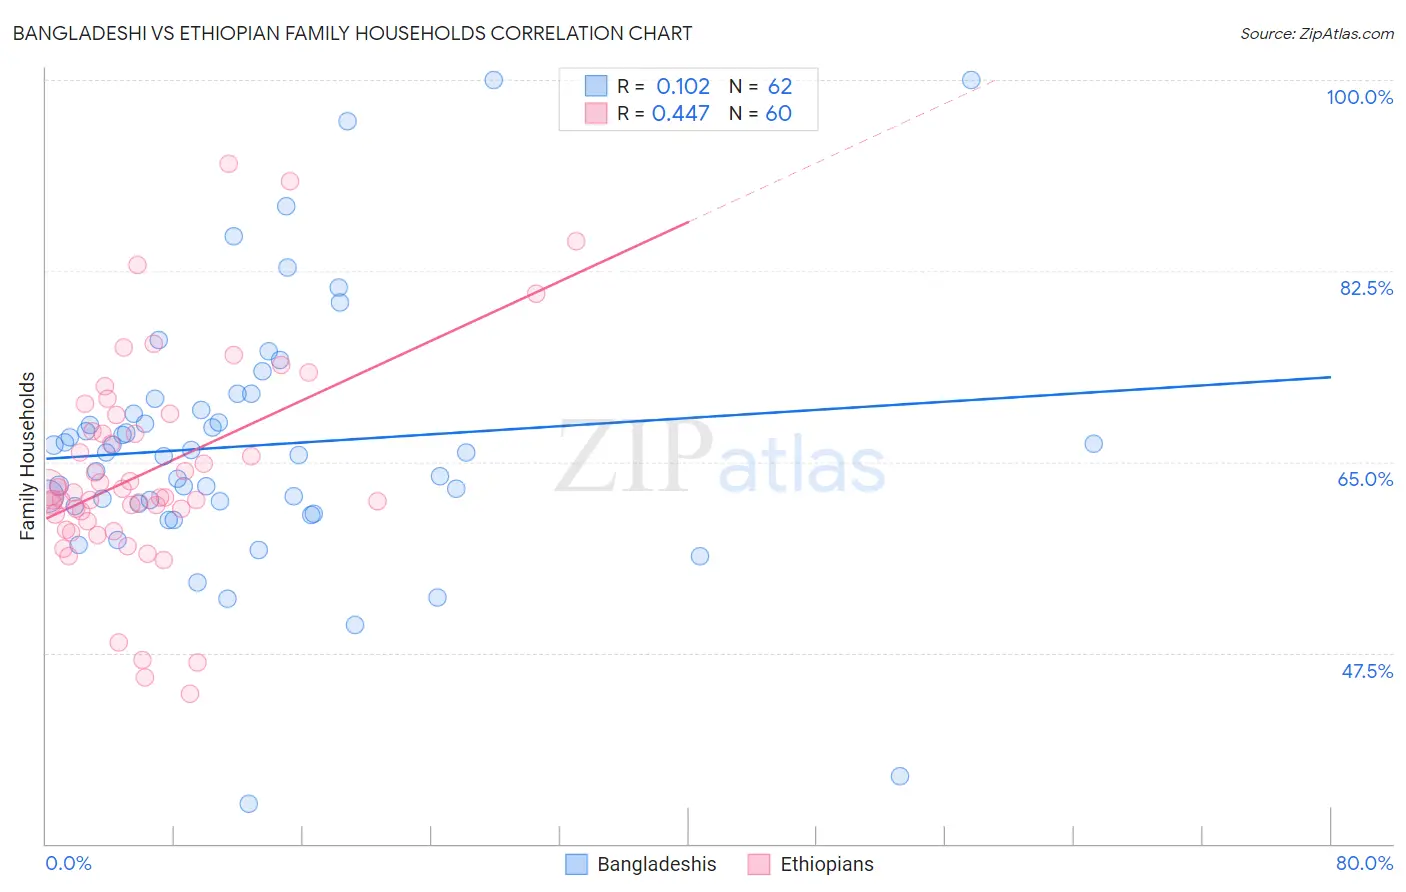
Bangladeshi vs Ethiopian Family Households Correlation Chart
The statistical analysis conducted on geographies consisting of 141,333,062 people shows a poor positive correlation between the proportion of Bangladeshis and percentage of family households in the United States with a correlation coefficient (R) of 0.102 and weighted average of 64.3%. Similarly, the statistical analysis conducted on geographies consisting of 223,101,453 people shows a moderate positive correlation between the proportion of Ethiopians and percentage of family households in the United States with a correlation coefficient (R) of 0.447 and weighted average of 61.2%, a difference of 4.9%.
Family Households Correlation Summary
| Measurement | Bangladeshi | Ethiopian |
| Minimum | 33.7% | 43.8% |
| Maximum | 100.0% | 92.3% |
| Range | 66.3% | 48.5% |
| Mean | 66.5% | 64.2% |
| Median | 65.9% | 62.0% |
| Interquartile 25% (IQ1) | 61.1% | 59.9% |
| Interquartile 75% (IQ3) | 69.8% | 68.5% |
| Interquartile Range (IQR) | 8.7% | 8.6% |
| Standard Deviation (Sample) | 11.9% | 9.7% |
| Standard Deviation (Population) | 11.8% | 9.6% |
Similar Demographics by Family Households
Demographics Similar to Bangladeshis by Family Households
In terms of family households, the demographic groups most similar to Bangladeshis are Vietnamese (64.2%, a difference of 0.010%), Immigrants from Micronesia (64.2%, a difference of 0.030%), Jamaican (64.2%, a difference of 0.050%), Immigrants from Germany (64.3%, a difference of 0.080%), and Immigrants from Ukraine (64.2%, a difference of 0.080%).
| Demographics | Rating | Rank | Family Households |
| Hondurans | 57.5 /100 | #168 | Average 64.4% |
| Iraqis | 56.0 /100 | #169 | Average 64.4% |
| Armenians | 55.9 /100 | #170 | Average 64.4% |
| Ute | 54.6 /100 | #171 | Average 64.3% |
| Dutch West Indians | 53.9 /100 | #172 | Average 64.3% |
| Immigrants | Sierra Leone | 52.5 /100 | #173 | Average 64.3% |
| Immigrants | Germany | 50.0 /100 | #174 | Average 64.3% |
| Bangladeshis | 44.3 /100 | #175 | Average 64.3% |
| Vietnamese | 43.6 /100 | #176 | Average 64.2% |
| Immigrants | Micronesia | 42.3 /100 | #177 | Average 64.2% |
| Jamaicans | 40.6 /100 | #178 | Average 64.2% |
| Immigrants | Ukraine | 38.2 /100 | #179 | Fair 64.2% |
| Immigrants | Honduras | 35.0 /100 | #180 | Fair 64.2% |
| Immigrants | Trinidad and Tobago | 34.9 /100 | #181 | Fair 64.2% |
| Ukrainians | 34.6 /100 | #182 | Fair 64.2% |
Demographics Similar to Ethiopians by Family Households
In terms of family households, the demographic groups most similar to Ethiopians are Immigrants from France (61.3%, a difference of 0.070%), Immigrants from Australia (61.3%, a difference of 0.080%), Immigrants from Ethiopia (61.2%, a difference of 0.080%), Immigrants from Eastern Africa (61.1%, a difference of 0.16%), and Cambodian (61.4%, a difference of 0.21%).
| Demographics | Rating | Rank | Family Households |
| Immigrants | Switzerland | 0.0 /100 | #325 | Tragic 61.6% |
| Indonesians | 0.0 /100 | #326 | Tragic 61.5% |
| Blacks/African Americans | 0.0 /100 | #327 | Tragic 61.5% |
| Kiowa | 0.0 /100 | #328 | Tragic 61.4% |
| Cambodians | 0.0 /100 | #329 | Tragic 61.4% |
| Immigrants | Australia | 0.0 /100 | #330 | Tragic 61.3% |
| Immigrants | France | 0.0 /100 | #331 | Tragic 61.3% |
| Ethiopians | 0.0 /100 | #332 | Tragic 61.2% |
| Immigrants | Ethiopia | 0.0 /100 | #333 | Tragic 61.2% |
| Immigrants | Eastern Africa | 0.0 /100 | #334 | Tragic 61.1% |
| Carpatho Rusyns | 0.0 /100 | #335 | Tragic 61.1% |
| German Russians | 0.0 /100 | #336 | Tragic 60.9% |
| Soviet Union | 0.0 /100 | #337 | Tragic 60.9% |
| Immigrants | Eritrea | 0.0 /100 | #338 | Tragic 60.8% |
| Immigrants | Saudi Arabia | 0.0 /100 | #339 | Tragic 60.7% |