Bahamian vs Immigrants from Africa Average Family Size
COMPARE
Bahamian
Immigrants from Africa
Average Family Size
Average Family Size Comparison
Bahamians
Immigrants from Africa
3.28
AVERAGE FAMILY SIZE
96.6/ 100
METRIC RATING
110th/ 347
METRIC RANK
3.25
AVERAGE FAMILY SIZE
77.9/ 100
METRIC RATING
146th/ 347
METRIC RANK
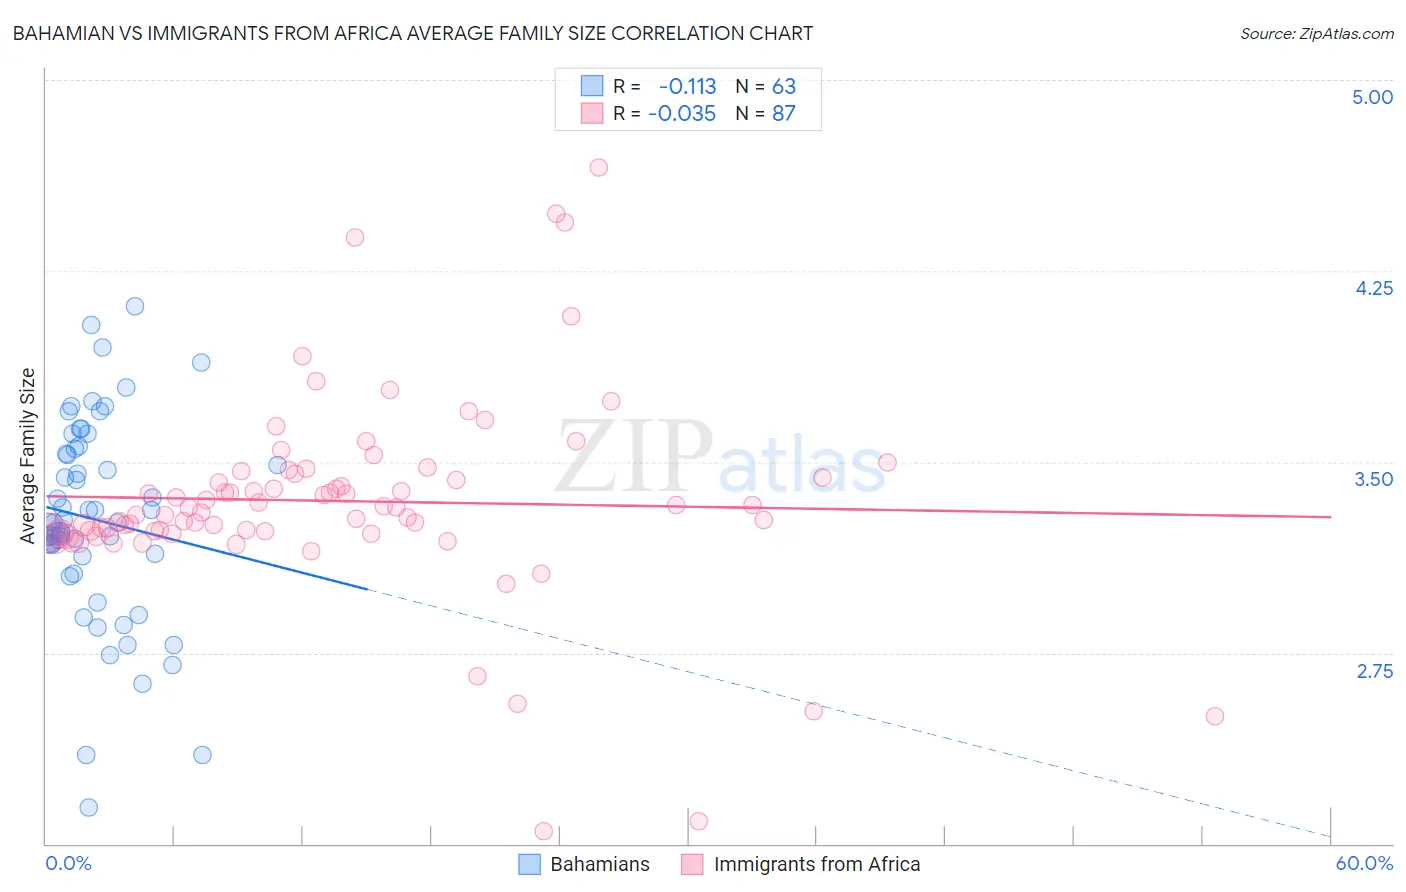
Bahamian vs Immigrants from Africa Average Family Size Correlation Chart
The statistical analysis conducted on geographies consisting of 112,635,727 people shows a poor negative correlation between the proportion of Bahamians and average family size in the United States with a correlation coefficient (R) of -0.113 and weighted average of 3.28. Similarly, the statistical analysis conducted on geographies consisting of 468,951,664 people shows no correlation between the proportion of Immigrants from Africa and average family size in the United States with a correlation coefficient (R) of -0.035 and weighted average of 3.25, a difference of 0.94%.
Average Family Size Correlation Summary
| Measurement | Bahamian | Immigrants from Africa |
| Minimum | 2.14 | 2.05 |
| Maximum | 4.11 | 4.66 |
| Range | 1.97 | 2.61 |
| Mean | 3.27 | 3.35 |
| Median | 3.26 | 3.32 |
| Interquartile 25% (IQ1) | 3.13 | 3.23 |
| Interquartile 75% (IQ3) | 3.55 | 3.45 |
| Interquartile Range (IQR) | 0.42 | 0.23 |
| Standard Deviation (Sample) | 0.40 | 0.40 |
| Standard Deviation (Population) | 0.39 | 0.40 |
Similar Demographics by Average Family Size
Demographics Similar to Bahamians by Average Family Size
In terms of average family size, the demographic groups most similar to Bahamians are Puerto Rican (3.28, a difference of 0.020%), Indonesian (3.28, a difference of 0.050%), Asian (3.28, a difference of 0.060%), Black/African American (3.27, a difference of 0.11%), and Immigrants from Panama (3.27, a difference of 0.12%).
| Demographics | Rating | Rank | Average Family Size |
| Immigrants | Western Africa | 98.4 /100 | #103 | Exceptional 3.29 |
| Bolivians | 98.3 /100 | #104 | Exceptional 3.29 |
| Immigrants | Ghana | 98.1 /100 | #105 | Exceptional 3.29 |
| Paiute | 98.0 /100 | #106 | Exceptional 3.29 |
| Ghanaians | 98.0 /100 | #107 | Exceptional 3.29 |
| Asians | 97.0 /100 | #108 | Exceptional 3.28 |
| Puerto Ricans | 96.7 /100 | #109 | Exceptional 3.28 |
| Bahamians | 96.6 /100 | #110 | Exceptional 3.28 |
| Indonesians | 96.2 /100 | #111 | Exceptional 3.28 |
| Blacks/African Americans | 95.7 /100 | #112 | Exceptional 3.27 |
| Immigrants | Panama | 95.6 /100 | #113 | Exceptional 3.27 |
| South Americans | 95.1 /100 | #114 | Exceptional 3.27 |
| Immigrants | Liberia | 95.0 /100 | #115 | Exceptional 3.27 |
| Immigrants | South America | 95.0 /100 | #116 | Exceptional 3.27 |
| Kiowa | 94.8 /100 | #117 | Exceptional 3.27 |
Demographics Similar to Immigrants from Africa by Average Family Size
In terms of average family size, the demographic groups most similar to Immigrants from Africa are Armenian (3.25, a difference of 0.010%), Tsimshian (3.25, a difference of 0.060%), Immigrants from Jordan (3.24, a difference of 0.060%), Blackfeet (3.24, a difference of 0.070%), and Liberian (3.25, a difference of 0.090%).
| Demographics | Rating | Rank | Average Family Size |
| Immigrants | Ethiopia | 81.6 /100 | #139 | Excellent 3.25 |
| Sub-Saharan Africans | 81.6 /100 | #140 | Excellent 3.25 |
| Venezuelans | 81.4 /100 | #141 | Excellent 3.25 |
| Liberians | 81.2 /100 | #142 | Excellent 3.25 |
| Bhutanese | 81.0 /100 | #143 | Excellent 3.25 |
| Tsimshian | 80.2 /100 | #144 | Excellent 3.25 |
| Armenians | 78.2 /100 | #145 | Good 3.25 |
| Immigrants | Africa | 77.9 /100 | #146 | Good 3.25 |
| Immigrants | Jordan | 75.7 /100 | #147 | Good 3.24 |
| Blackfeet | 75.0 /100 | #148 | Good 3.24 |
| Assyrians/Chaldeans/Syriacs | 73.8 /100 | #149 | Good 3.24 |
| Indians (Asian) | 73.6 /100 | #150 | Good 3.24 |
| Jordanians | 73.5 /100 | #151 | Good 3.24 |
| Spanish Americans | 72.5 /100 | #152 | Good 3.24 |
| Immigrants | Eritrea | 71.4 /100 | #153 | Good 3.24 |