Argentinean vs Soviet Union Births to Unmarried Women
COMPARE
Argentinean
Soviet Union
Births to Unmarried Women
Births to Unmarried Women Comparison
Argentineans
Soviet Union
30.0%
BIRTHS TO UNMARRIED WOMEN
90.5/ 100
METRIC RATING
119th/ 347
METRIC RANK
26.3%
BIRTHS TO UNMARRIED WOMEN
99.9/ 100
METRIC RATING
21st/ 347
METRIC RANK
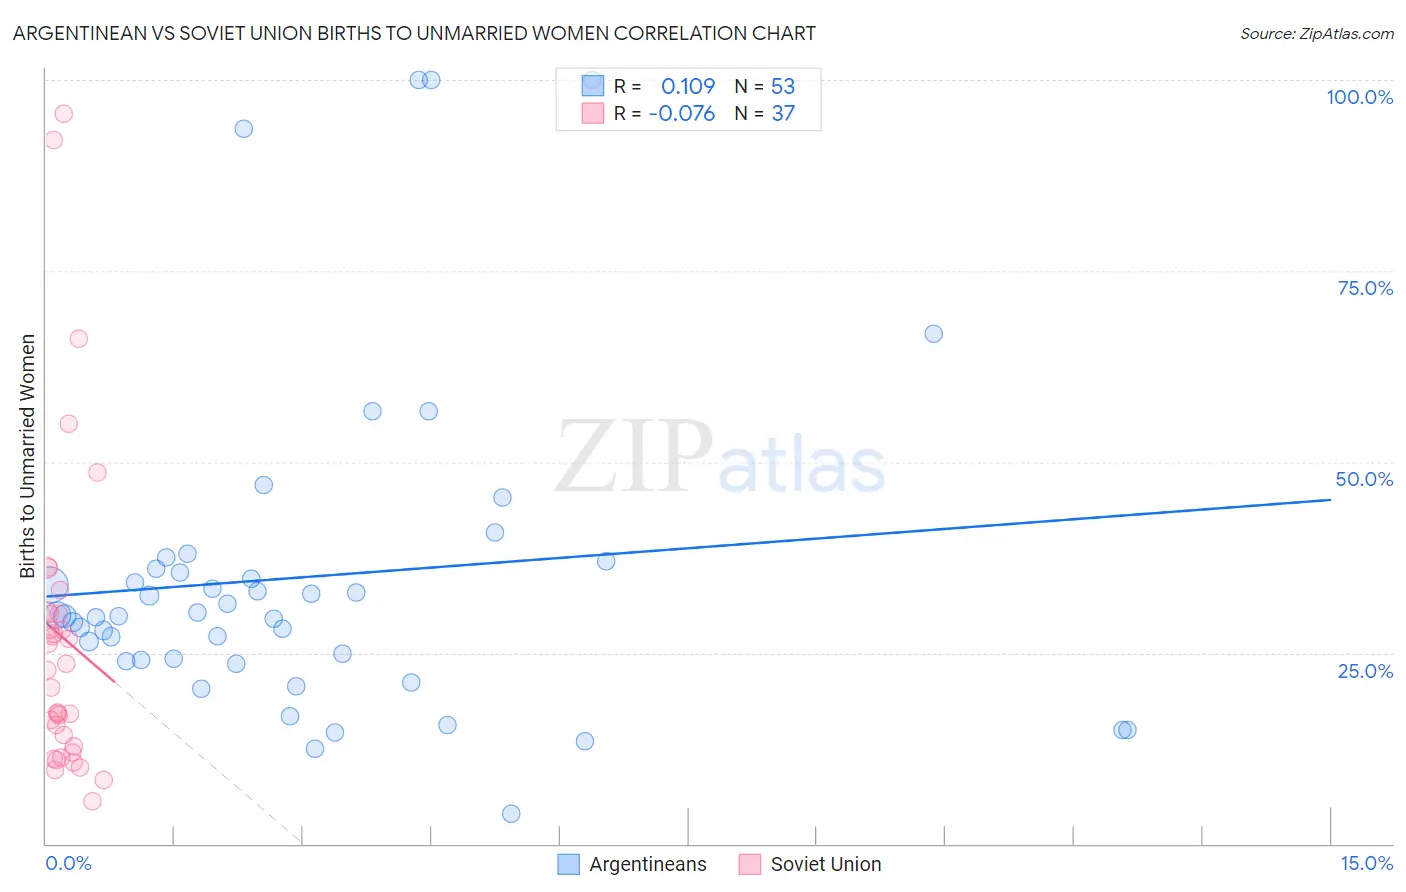
Argentinean vs Soviet Union Births to Unmarried Women Correlation Chart
The statistical analysis conducted on geographies consisting of 280,462,153 people shows a poor positive correlation between the proportion of Argentineans and percentage of births to unmarried women in the United States with a correlation coefficient (R) of 0.109 and weighted average of 30.0%. Similarly, the statistical analysis conducted on geographies consisting of 42,942,883 people shows a slight negative correlation between the proportion of Soviet Union and percentage of births to unmarried women in the United States with a correlation coefficient (R) of -0.076 and weighted average of 26.3%, a difference of 14.0%.
Births to Unmarried Women Correlation Summary
| Measurement | Argentinean | Soviet Union |
| Minimum | 4.0% | 5.5% |
| Maximum | 100.0% | 95.6% |
| Range | 96.0% | 90.1% |
| Mean | 34.9% | 27.0% |
| Median | 29.9% | 22.8% |
| Interquartile 25% (IQ1) | 24.0% | 12.3% |
| Interquartile 75% (IQ3) | 36.5% | 30.3% |
| Interquartile Range (IQR) | 12.5% | 18.0% |
| Standard Deviation (Sample) | 21.5% | 20.9% |
| Standard Deviation (Population) | 21.3% | 20.6% |
Similar Demographics by Births to Unmarried Women
Demographics Similar to Argentineans by Births to Unmarried Women
In terms of births to unmarried women, the demographic groups most similar to Argentineans are Immigrants from Norway (29.9%, a difference of 0.14%), Immigrants from Netherlands (29.9%, a difference of 0.16%), Ugandan (30.1%, a difference of 0.36%), Immigrants from Italy (29.9%, a difference of 0.37%), and Korean (30.1%, a difference of 0.44%).
| Demographics | Rating | Rank | Births to Unmarried Women |
| Basques | 93.0 /100 | #112 | Exceptional 29.7% |
| Scandinavians | 92.7 /100 | #113 | Exceptional 29.8% |
| Immigrants | Croatia | 92.6 /100 | #114 | Exceptional 29.8% |
| Ethiopians | 91.9 /100 | #115 | Exceptional 29.8% |
| Immigrants | Italy | 91.7 /100 | #116 | Exceptional 29.9% |
| Immigrants | Netherlands | 91.1 /100 | #117 | Exceptional 29.9% |
| Immigrants | Norway | 91.0 /100 | #118 | Exceptional 29.9% |
| Argentineans | 90.5 /100 | #119 | Exceptional 30.0% |
| Ugandans | 89.2 /100 | #120 | Excellent 30.1% |
| Koreans | 88.9 /100 | #121 | Excellent 30.1% |
| Immigrants | Argentina | 88.7 /100 | #122 | Excellent 30.1% |
| Syrians | 88.2 /100 | #123 | Excellent 30.2% |
| Croatians | 88.0 /100 | #124 | Excellent 30.2% |
| Vietnamese | 87.7 /100 | #125 | Excellent 30.2% |
| Europeans | 87.2 /100 | #126 | Excellent 30.2% |
Demographics Similar to Soviet Union by Births to Unmarried Women
In terms of births to unmarried women, the demographic groups most similar to Soviet Union are Immigrants from Korea (26.3%, a difference of 0.13%), Burmese (26.4%, a difference of 0.22%), Armenian (26.2%, a difference of 0.35%), Immigrants from Japan (26.4%, a difference of 0.41%), and Immigrants from Armenia (26.1%, a difference of 0.93%).
| Demographics | Rating | Rank | Births to Unmarried Women |
| Immigrants | Lebanon | 100.0 /100 | #14 | Exceptional 25.3% |
| Immigrants | Singapore | 100.0 /100 | #15 | Exceptional 25.6% |
| Immigrants | Belarus | 100.0 /100 | #16 | Exceptional 25.6% |
| Immigrants | Uzbekistan | 100.0 /100 | #17 | Exceptional 25.8% |
| Immigrants | Armenia | 99.9 /100 | #18 | Exceptional 26.1% |
| Armenians | 99.9 /100 | #19 | Exceptional 26.2% |
| Immigrants | Korea | 99.9 /100 | #20 | Exceptional 26.3% |
| Soviet Union | 99.9 /100 | #21 | Exceptional 26.3% |
| Burmese | 99.9 /100 | #22 | Exceptional 26.4% |
| Immigrants | Japan | 99.9 /100 | #23 | Exceptional 26.4% |
| Immigrants | Australia | 99.9 /100 | #24 | Exceptional 26.6% |
| Cambodians | 99.9 /100 | #25 | Exceptional 26.7% |
| Asians | 99.9 /100 | #26 | Exceptional 26.8% |
| Immigrants | Asia | 99.9 /100 | #27 | Exceptional 26.8% |
| Okinawans | 99.8 /100 | #28 | Exceptional 26.9% |