Argentinean vs Delaware Divorced or Separated

COMPARE

Argentinean
Race
Ancestry
AfghanAfricanAlaska NativeAlaskan AthabascanAlbanianAleutAlsatianAmericanApacheArabArapahoArgentineanArmenianAssyrian/Chaldean/SyriacAustralianAustrianBahamianBangladeshiBarbadianBasqueBelgianBelizeanBermudanBhutaneseBlackfeetBolivianBrazilianBritishBritish West IndianBulgarianBurmeseCajunCambodianCanadianCape VerdeanCarpatho RusynCelticCentral AmericanCentral American IndianCherokeeCheyenneChickasawChileanChineseChippewaChoctawColombianColvilleComancheCosta RicanCreeCreekCroatianCrowCubanCypriotCzechCzechoslovakianDanishDominicanDutchDutch West IndianEastern EuropeanEcuadorianEgyptianEnglishEstonianEthiopianEuropeanFijianFilipinoFinnishFrenchFrench American IndianFrench CanadianGermanGerman RussianGhanaianGreekGuamanian/ChamorroGuatemalanGuyaneseHaitianHmongHonduranHopiHoumaHungarianIcelanderIndian (Asian)IndonesianInupiatIranianIraqiIrishIroquoisIsraeliItalianJamaicanJapaneseJordanianKenyanKiowaKoreanLaotianLatvianLebaneseLiberianLithuanianLumbeeLuxembourgerMacedonianMalaysianMalteseMarshalleseMenomineeMexicanMexican American IndianMongolianMoroccanNative HawaiianNavajoNepaleseNew ZealanderNicaraguanNigerianNorthern EuropeanNorwegianOkinawanOsageOttawaPaiutePakistaniPalestinianPanamanianParaguayanPennsylvania GermanPeruvianPimaPolishPortuguesePotawatomiPuebloPuerto RicanPuget Sound SalishRomanianRussianSalvadoranSamoanScandinavianScotch-IrishScottishSeminoleSenegaleseSerbianShoshoneSierra LeoneanSiouxSlavicSlovakSloveneSomaliSouth AfricanSouth AmericanSouth American IndianSoviet UnionSpaniardSpanishSpanish AmericanSpanish American IndianSri LankanSubsaharan AfricanSudaneseSwedishSwissSyrianTaiwaneseThaiTlingit-HaidaTohono O'OdhamTonganTrinidadian and TobagonianTsimshianTurkishU.S. Virgin IslanderUgandanUkrainianUruguayanUteVenezuelanVietnameseWelshWest IndianYakamaYaquiYugoslavianYumanYup'ikZimbabwean
Immigration
NonimmigrantsImmigrantsAfghanistanAfricaAlbaniaArgentinaArmeniaAsiaAustraliaAustriaBahamasBangladeshBarbadosBelarusBelgiumBelizeBoliviaBosnia and HerzegovinaBrazilBulgariaBurma/MyanmarCabo VerdeCambodiaCameroonCanadaCaribbeanCentral AmericaChileChinaColombiaCongoCosta RicaCroatiaCubaCzechoslovakiaDenmarkDominicaDominican RepublicEastern AfricaEastern AsiaEastern EuropeEcuadorEgyptEl SalvadorEnglandEritreaEthiopiaEuropeFijiFranceGermanyGhanaGreeceGrenadaGuatemalaGuyanaHaitiHondurasHong KongHungaryIndiaIndonesiaIranIraqIrelandIsraelItalyJamaicaJapanJordanKazakhstanKenyaKoreaKuwaitLaosLatin AmericaLatviaLebanonLiberiaLithuaniaMalaysiaMexicoMicronesiaMiddle AfricaMoldovaMoroccoNepalNetherlandsNicaraguaNigeriaNorth AmericaNorth MacedoniaNorthern AfricaNorthern EuropeNorwayOceaniaPakistanPanamaPeruPhilippinesPolandPortugalRomaniaRussiaSaudi ArabiaScotlandSenegalSerbiaSierra LeoneSingaporeSomaliaSouth AfricaSouth AmericaSouth Central AsiaSouth Eastern AsiaSouthern EuropeSpainSri LankaSt. Vincent and the GrenadinesSudanSwedenSwitzerlandSyriaTaiwanThailandTrinidad and TobagoTurkeyUgandaUkraineUruguayUzbekistanVenezuelaVietnamWest IndiesWestern AfricaWestern AsiaWestern EuropeYemenZaireZimbabweAzores
Delaware
Race
Ancestry
AfghanAfricanAlaska NativeAlaskan AthabascanAlbanianAleutAlsatianAmericanApacheArabArapahoArmenianAssyrian/Chaldean/SyriacAustralianAustrianBahamianBangladeshiBarbadianBasqueBelgianBelizeanBermudanBhutaneseBlackfeetBolivianBrazilianBritishBritish West IndianBulgarianBurmeseCajunCambodianCanadianCape VerdeanCarpatho RusynCelticCentral AmericanCentral American IndianCherokeeCheyenneChickasawChileanChineseChippewaChoctawColombianColvilleComancheCosta RicanCreeCreekCroatianCrowCubanCypriotCzechCzechoslovakianDanishDelawareDominicanDutchDutch West IndianEastern EuropeanEcuadorianEgyptianEnglishEstonianEthiopianEuropeanFijianFilipinoFinnishFrenchFrench American IndianFrench CanadianGermanGerman RussianGhanaianGreekGuamanian/ChamorroGuatemalanGuyaneseHaitianHmongHonduranHopiHoumaHungarianIcelanderIndian (Asian)IndonesianInupiatIranianIraqiIrishIroquoisIsraeliItalianJamaicanJapaneseJordanianKenyanKiowaKoreanLaotianLatvianLebaneseLiberianLithuanianLumbeeLuxembourgerMacedonianMalaysianMalteseMarshalleseMenomineeMexicanMexican American IndianMongolianMoroccanNative HawaiianNavajoNepaleseNew ZealanderNicaraguanNigerianNorthern EuropeanNorwegianOkinawanOsageOttawaPaiutePakistaniPalestinianPanamanianParaguayanPennsylvania GermanPeruvianPimaPolishPortuguesePotawatomiPuebloPuerto RicanPuget Sound SalishRomanianRussianSalvadoranSamoanScandinavianScotch-IrishScottishSeminoleSenegaleseSerbianShoshoneSierra LeoneanSiouxSlavicSlovakSloveneSomaliSouth AfricanSouth AmericanSouth American IndianSoviet UnionSpaniardSpanishSpanish AmericanSpanish American IndianSri LankanSubsaharan AfricanSudaneseSwedishSwissSyrianTaiwaneseThaiTlingit-HaidaTohono O'OdhamTonganTrinidadian and TobagonianTsimshianTurkishU.S. Virgin IslanderUgandanUkrainianUruguayanUteVenezuelanVietnameseWelshWest IndianYakamaYaquiYugoslavianYumanYup'ikZimbabwean
Immigration
NonimmigrantsImmigrantsAfghanistanAfricaAlbaniaArgentinaArmeniaAsiaAustraliaAustriaBahamasBangladeshBarbadosBelarusBelgiumBelizeBoliviaBosnia and HerzegovinaBrazilBulgariaBurma/MyanmarCabo VerdeCambodiaCameroonCanadaCaribbeanCentral AmericaChileChinaColombiaCongoCosta RicaCroatiaCubaCzechoslovakiaDenmarkDominicaDominican RepublicEastern AfricaEastern AsiaEastern EuropeEcuadorEgyptEl SalvadorEnglandEritreaEthiopiaEuropeFijiFranceGermanyGhanaGreeceGrenadaGuatemalaGuyanaHaitiHondurasHong KongHungaryIndiaIndonesiaIranIraqIrelandIsraelItalyJamaicaJapanJordanKazakhstanKenyaKoreaKuwaitLaosLatin AmericaLatviaLebanonLiberiaLithuaniaMalaysiaMexicoMicronesiaMiddle AfricaMoldovaMoroccoNepalNetherlandsNicaraguaNigeriaNorth AmericaNorth MacedoniaNorthern AfricaNorthern EuropeNorwayOceaniaPakistanPanamaPeruPhilippinesPolandPortugalRomaniaRussiaSaudi ArabiaScotlandSenegalSerbiaSierra LeoneSingaporeSomaliaSouth AfricaSouth AmericaSouth Central AsiaSouth Eastern AsiaSouthern EuropeSpainSri LankaSt. Vincent and the GrenadinesSudanSwedenSwitzerlandSyriaTaiwanThailandTrinidad and TobagoTurkeyUgandaUkraineUruguayUzbekistanVenezuelaVietnamWest IndiesWestern AfricaWestern AsiaWestern EuropeYemenZaireZimbabweAzores
Divorced or Separated
Income
Poverty
Unemployment
Labor Participation
Family Structure
Vehicle Availability
Education Level
Disability

Divorced or Separated Comparison

Argentineans

Delaware

Excellent
Tragic
11.9%
DIVORCED OR SEPARATED
85.1/ 100
METRIC RATING
134th/ 347
METRIC RANK
12.7%
DIVORCED OR SEPARATED
0.1/ 100
METRIC RATING
283rd/ 347
METRIC RANK

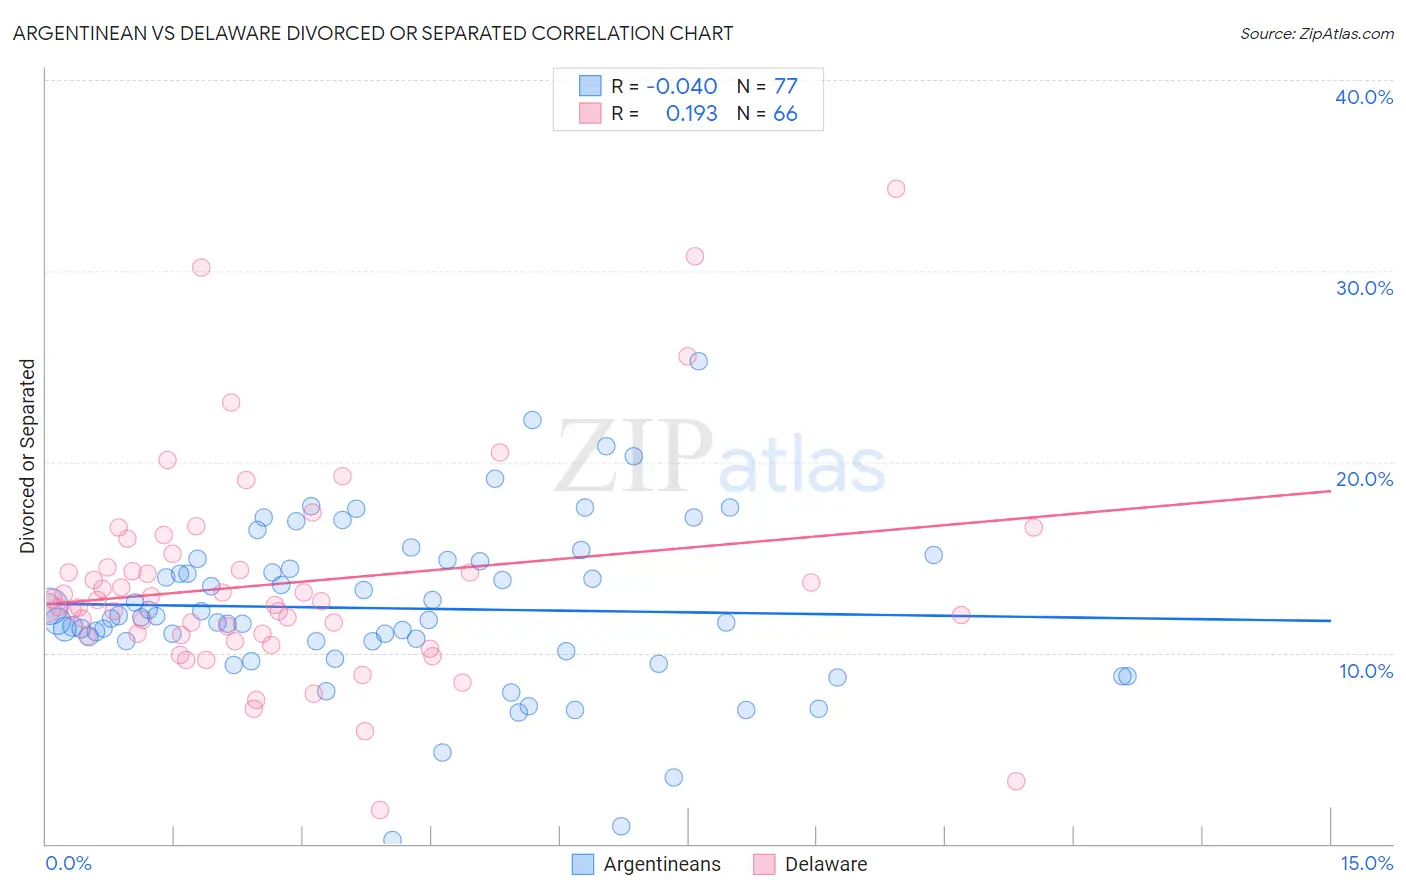
Argentinean vs Delaware Divorced or Separated Correlation Chart

The statistical analysis conducted on geographies consisting of 297,042,213 people shows no correlation between the proportion of Argentineans and percentage of population currently divorced or separated in the United States with a correlation coefficient (R) of -0.040 and weighted average of 11.9%. Similarly, the statistical analysis conducted on geographies consisting of 96,237,002 people shows a poor positive correlation between the proportion of Delaware and percentage of population currently divorced or separated in the United States with a correlation coefficient (R) of 0.193 and weighted average of 12.7%, a difference of 7.3%.
Argentinean vs Delaware Divorced or Separated

Divorced or Separated Correlation Summary

MeasurementArgentineanDelaware
Minimum0.20%1.8%
Maximum25.3%34.3%
Range25.1%32.5%
Mean12.3%13.6%
Median11.8%12.6%
Interquartile 25% (IQ1)10.3%10.9%
Interquartile 75% (IQ3)14.8%14.5%
Interquartile Range (IQR)4.5%3.5%
Standard Deviation (Sample)4.3%5.6%
Standard Deviation (Population)4.3%5.6%

Similar Demographics by Divorced or Separated

Demographics Similar to Argentineans by Divorced or Separated

In terms of divorced or separated, the demographic groups most similar to Argentineans are Danish (11.9%, a difference of 0.020%), Carpatho Rusyn (11.9%, a difference of 0.020%), Alsatian (11.9%, a difference of 0.080%), Immigrants from Netherlands (11.9%, a difference of 0.080%), and Australian (11.9%, a difference of 0.10%).
DemographicsRating | RankDivorced or Separated
South Africans
88.9
/100
|
#127
Excellent
11.8%
Immigrants | Ecuador
88.9
/100
|
#128
Excellent
11.8%
Immigrants | St. Vincent and the Grenadines
88.4
/100
|
#129
Excellent
11.8%
Immigrants | Austria
88.2
/100
|
#130
Excellent
11.8%
Immigrants | Cambodia
88.2
/100
|
#131
Excellent
11.8%
Immigrants | Afghanistan
87.9
/100
|
#132
Excellent
11.8%
New Zealanders
87.5
/100
|
#133
Excellent
11.9%
Argentineans
85.1
/100
|
#134
Excellent
11.9%
Danes
84.8
/100
|
#135
Excellent
11.9%
Carpatho Rusyns
84.8
/100
|
#136
Excellent
11.9%
Alsatians
84.0
/100
|
#137
Excellent
11.9%
Immigrants | Netherlands
83.9
/100
|
#138
Excellent
11.9%
Australians
83.6
/100
|
#139
Excellent
11.9%
Lebanese
83.4
/100
|
#140
Excellent
11.9%
Immigrants | Morocco
82.9
/100
|
#141
Excellent
11.9%

Demographics Similar to Delaware by Divorced or Separated

In terms of divorced or separated, the demographic groups most similar to Delaware are Subsaharan African (12.7%, a difference of 0.010%), Nonimmigrants (12.8%, a difference of 0.090%), Pueblo (12.7%, a difference of 0.13%), French (12.8%, a difference of 0.13%), and Immigrants from Zaire (12.7%, a difference of 0.17%).
DemographicsRating | RankDivorced or Separated
Spaniards
0.2
/100
|
#276
Tragic
12.7%
Dominicans
0.2
/100
|
#277
Tragic
12.7%
Lumbee
0.2
/100
|
#278
Tragic
12.7%
Immigrants | Dominican Republic
0.2
/100
|
#279
Tragic
12.7%
Immigrants | Zaire
0.2
/100
|
#280
Tragic
12.7%
Pueblo
0.2
/100
|
#281
Tragic
12.7%
Sub-Saharan Africans
0.1
/100
|
#282
Tragic
12.7%
Delaware
0.1
/100
|
#283
Tragic
12.7%
Immigrants | Nonimmigrants
0.1
/100
|
#284
Tragic
12.8%
French
0.1
/100
|
#285
Tragic
12.8%
Spanish
0.1
/100
|
#286
Tragic
12.8%
Hondurans
0.1
/100
|
#287
Tragic
12.8%
French Canadians
0.1
/100
|
#288
Tragic
12.8%
Iroquois
0.0
/100
|
#289
Tragic
12.9%
Pima
0.0
/100
|
#290
Tragic
12.9%