Arapaho vs Immigrants from Belize Currently Married
COMPARE
Arapaho
Immigrants from Belize
Currently Married
Currently Married Comparison
Arapaho
Immigrants from Belize
40.5%
CURRENTLY MARRIED
0.0/ 100
METRIC RATING
328th/ 347
METRIC RANK
41.8%
CURRENTLY MARRIED
0.0/ 100
METRIC RATING
308th/ 347
METRIC RANK
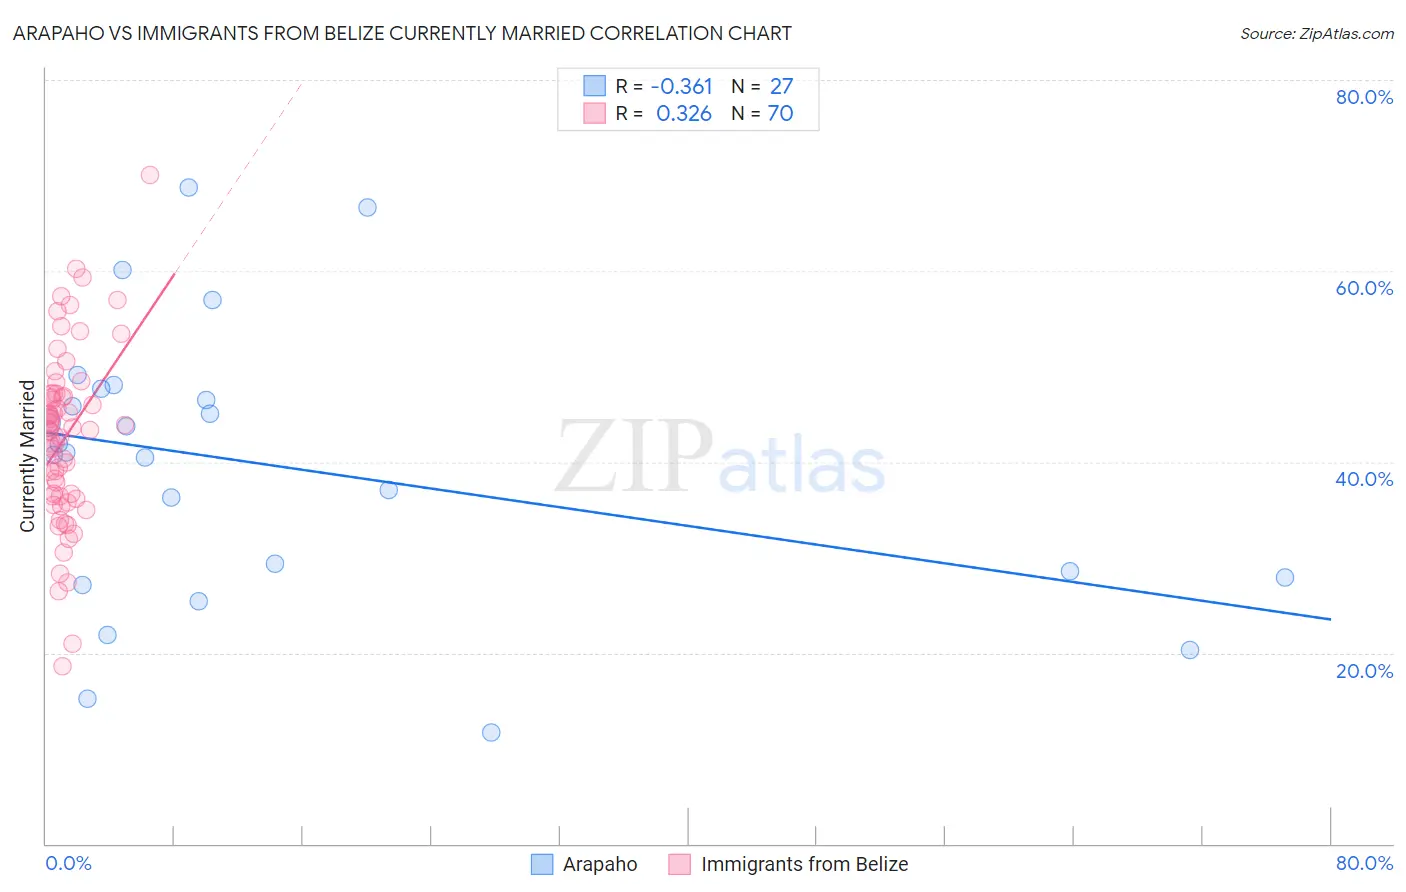
Arapaho vs Immigrants from Belize Currently Married Correlation Chart
The statistical analysis conducted on geographies consisting of 29,779,567 people shows a mild negative correlation between the proportion of Arapaho and percentage of population currently married in the United States with a correlation coefficient (R) of -0.361 and weighted average of 40.5%. Similarly, the statistical analysis conducted on geographies consisting of 130,322,630 people shows a mild positive correlation between the proportion of Immigrants from Belize and percentage of population currently married in the United States with a correlation coefficient (R) of 0.326 and weighted average of 41.8%, a difference of 3.1%.
Currently Married Correlation Summary
| Measurement | Arapaho | Immigrants from Belize |
| Minimum | 11.7% | 18.6% |
| Maximum | 68.7% | 70.1% |
| Range | 57.0% | 51.5% |
| Mean | 39.5% | 42.6% |
| Median | 41.0% | 43.4% |
| Interquartile 25% (IQ1) | 27.9% | 36.4% |
| Interquartile 75% (IQ3) | 47.6% | 47.1% |
| Interquartile Range (IQR) | 19.7% | 10.7% |
| Standard Deviation (Sample) | 14.5% | 9.2% |
| Standard Deviation (Population) | 14.3% | 9.2% |
Demographics Similar to Arapaho and Immigrants from Belize by Currently Married
In terms of currently married, the demographic groups most similar to Arapaho are Senegalese (40.6%, a difference of 0.040%), Barbadian (40.6%, a difference of 0.22%), U.S. Virgin Islander (40.7%, a difference of 0.35%), Immigrants from Senegal (40.7%, a difference of 0.40%), and Immigrants from West Indies (40.7%, a difference of 0.41%). Similarly, the demographic groups most similar to Immigrants from Belize are Immigrants from Liberia (41.8%, a difference of 0.11%), Guyanese (41.6%, a difference of 0.48%), Trinidadian and Tobagonian (41.5%, a difference of 0.63%), Somali (41.5%, a difference of 0.81%), and Jamaican (41.4%, a difference of 1.1%).
| Demographics | Rating | Rank | Currently Married |
| Immigrants | Belize | 0.0 /100 | #308 | Tragic 41.8% |
| Immigrants | Liberia | 0.0 /100 | #309 | Tragic 41.8% |
| Guyanese | 0.0 /100 | #310 | Tragic 41.6% |
| Trinidadians and Tobagonians | 0.0 /100 | #311 | Tragic 41.5% |
| Somalis | 0.0 /100 | #312 | Tragic 41.5% |
| Jamaicans | 0.0 /100 | #313 | Tragic 41.4% |
| West Indians | 0.0 /100 | #314 | Tragic 41.3% |
| Inupiat | 0.0 /100 | #315 | Tragic 41.3% |
| Immigrants | Caribbean | 0.0 /100 | #316 | Tragic 41.3% |
| Haitians | 0.0 /100 | #317 | Tragic 41.3% |
| Bahamians | 0.0 /100 | #318 | Tragic 41.2% |
| Immigrants | Somalia | 0.0 /100 | #319 | Tragic 41.2% |
| Immigrants | Jamaica | 0.0 /100 | #320 | Tragic 41.1% |
| Immigrants | Congo | 0.0 /100 | #321 | Tragic 41.1% |
| Immigrants | Haiti | 0.0 /100 | #322 | Tragic 41.0% |
| Immigrants | West Indies | 0.0 /100 | #323 | Tragic 40.7% |
| Immigrants | Senegal | 0.0 /100 | #324 | Tragic 40.7% |
| U.S. Virgin Islanders | 0.0 /100 | #325 | Tragic 40.7% |
| Barbadians | 0.0 /100 | #326 | Tragic 40.6% |
| Senegalese | 0.0 /100 | #327 | Tragic 40.6% |
| Arapaho | 0.0 /100 | #328 | Tragic 40.5% |