Arapaho vs Bulgarian Divorced or Separated
COMPARE
Arapaho
Bulgarian
Divorced or Separated
Divorced or Separated Comparison
Arapaho
Bulgarians
14.8%
DIVORCED OR SEPARATED
0.0/ 100
METRIC RATING
346th/ 347
METRIC RANK
11.5%
DIVORCED OR SEPARATED
99.3/ 100
METRIC RATING
84th/ 347
METRIC RANK
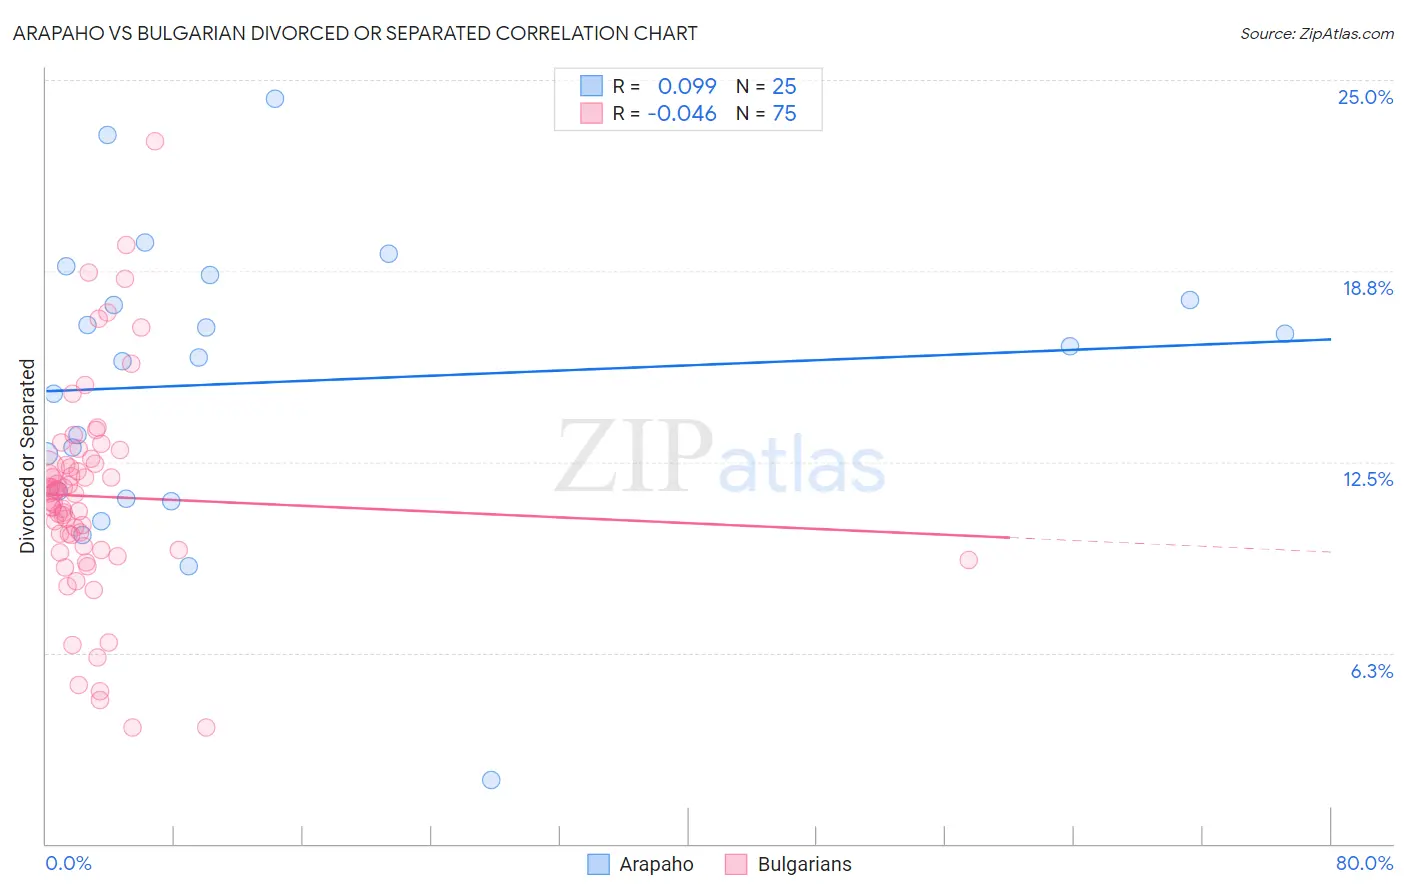
Arapaho vs Bulgarian Divorced or Separated Correlation Chart
The statistical analysis conducted on geographies consisting of 29,779,242 people shows a slight positive correlation between the proportion of Arapaho and percentage of population currently divorced or separated in the United States with a correlation coefficient (R) of 0.099 and weighted average of 14.8%. Similarly, the statistical analysis conducted on geographies consisting of 205,585,291 people shows no correlation between the proportion of Bulgarians and percentage of population currently divorced or separated in the United States with a correlation coefficient (R) of -0.046 and weighted average of 11.5%, a difference of 28.4%.
Divorced or Separated Correlation Summary
| Measurement | Arapaho | Bulgarian |
| Minimum | 2.1% | 3.8% |
| Maximum | 24.4% | 23.0% |
| Range | 22.3% | 19.2% |
| Mean | 15.1% | 11.4% |
| Median | 15.9% | 11.5% |
| Interquartile 25% (IQ1) | 11.4% | 9.6% |
| Interquartile 75% (IQ3) | 18.2% | 12.5% |
| Interquartile Range (IQR) | 6.8% | 2.9% |
| Standard Deviation (Sample) | 4.8% | 3.4% |
| Standard Deviation (Population) | 4.7% | 3.4% |
Similar Demographics by Divorced or Separated
Demographics Similar to Arapaho by Divorced or Separated
In terms of divorced or separated, the demographic groups most similar to Arapaho are Kiowa (14.5%, a difference of 2.1%), Cuban (14.5%, a difference of 2.2%), Immigrants from Cuba (15.2%, a difference of 2.8%), Creek (14.4%, a difference of 2.9%), and Seminole (14.3%, a difference of 3.9%).
| Demographics | Rating | Rank | Divorced or Separated |
| Puerto Ricans | 0.0 /100 | #333 | Tragic 13.9% |
| Immigrants | Bahamas | 0.0 /100 | #334 | Tragic 13.9% |
| Dutch West Indians | 0.0 /100 | #335 | Tragic 14.0% |
| Shoshone | 0.0 /100 | #336 | Tragic 14.0% |
| Crow | 0.0 /100 | #337 | Tragic 14.1% |
| Choctaw | 0.0 /100 | #338 | Tragic 14.1% |
| Colville | 0.0 /100 | #339 | Tragic 14.2% |
| Chickasaw | 0.0 /100 | #340 | Tragic 14.2% |
| Bahamians | 0.0 /100 | #341 | Tragic 14.2% |
| Seminole | 0.0 /100 | #342 | Tragic 14.3% |
| Creek | 0.0 /100 | #343 | Tragic 14.4% |
| Cubans | 0.0 /100 | #344 | Tragic 14.5% |
| Kiowa | 0.0 /100 | #345 | Tragic 14.5% |
| Arapaho | 0.0 /100 | #346 | Tragic 14.8% |
| Immigrants | Cuba | 0.0 /100 | #347 | Tragic 15.2% |
Demographics Similar to Bulgarians by Divorced or Separated
In terms of divorced or separated, the demographic groups most similar to Bulgarians are Immigrants from Bulgaria (11.5%, a difference of 0.020%), Immigrants from Romania (11.5%, a difference of 0.050%), Immigrants from Albania (11.5%, a difference of 0.060%), Russian (11.5%, a difference of 0.13%), and Immigrants from Latvia (11.6%, a difference of 0.13%).
| Demographics | Rating | Rank | Divorced or Separated |
| Immigrants | Italy | 99.5 /100 | #77 | Exceptional 11.5% |
| Afghans | 99.4 /100 | #78 | Exceptional 11.5% |
| Guyanese | 99.4 /100 | #79 | Exceptional 11.5% |
| Immigrants | Switzerland | 99.4 /100 | #80 | Exceptional 11.5% |
| Russians | 99.4 /100 | #81 | Exceptional 11.5% |
| Immigrants | Romania | 99.3 /100 | #82 | Exceptional 11.5% |
| Immigrants | Bulgaria | 99.3 /100 | #83 | Exceptional 11.5% |
| Bulgarians | 99.3 /100 | #84 | Exceptional 11.5% |
| Immigrants | Albania | 99.3 /100 | #85 | Exceptional 11.5% |
| Immigrants | Latvia | 99.2 /100 | #86 | Exceptional 11.6% |
| Immigrants | Nepal | 99.2 /100 | #87 | Exceptional 11.6% |
| Immigrants | Europe | 99.2 /100 | #88 | Exceptional 11.6% |
| Immigrants | Southern Europe | 99.1 /100 | #89 | Exceptional 11.6% |
| Zimbabweans | 99.0 /100 | #90 | Exceptional 11.6% |
| Spanish American Indians | 99.0 /100 | #91 | Exceptional 11.6% |