Arab vs Immigrants from Fiji Currently Married
COMPARE
Arab
Immigrants from Fiji
Currently Married
Currently Married Comparison
Arabs
Immigrants from Fiji
47.0%
CURRENTLY MARRIED
68.6/ 100
METRIC RATING
155th/ 347
METRIC RANK
46.2%
CURRENTLY MARRIED
25.0/ 100
METRIC RATING
193rd/ 347
METRIC RANK
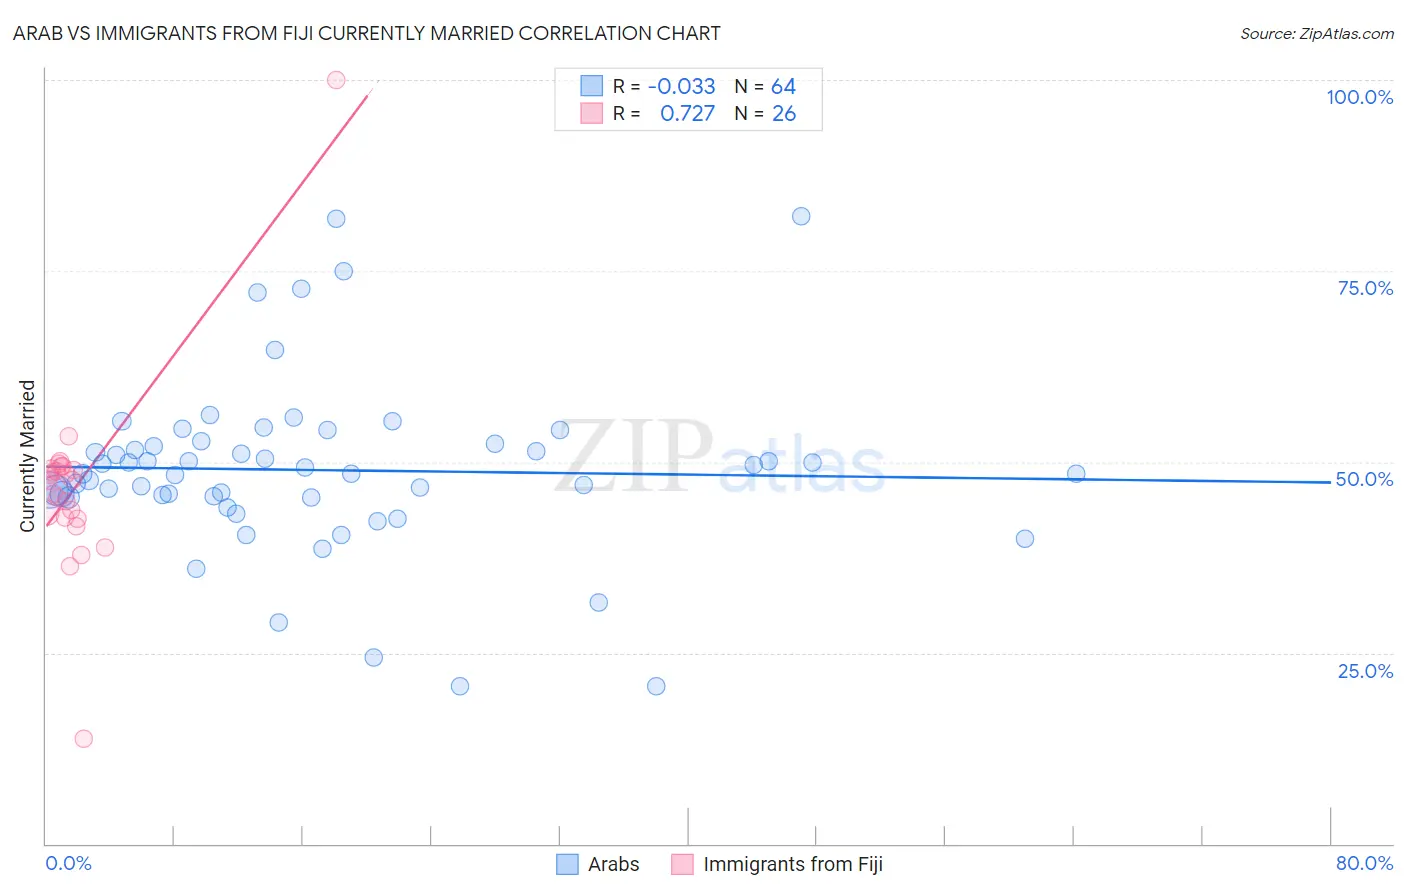
Arab vs Immigrants from Fiji Currently Married Correlation Chart
The statistical analysis conducted on geographies consisting of 486,767,077 people shows no correlation between the proportion of Arabs and percentage of population currently married in the United States with a correlation coefficient (R) of -0.033 and weighted average of 47.0%. Similarly, the statistical analysis conducted on geographies consisting of 93,756,204 people shows a strong positive correlation between the proportion of Immigrants from Fiji and percentage of population currently married in the United States with a correlation coefficient (R) of 0.727 and weighted average of 46.2%, a difference of 1.7%.
Currently Married Correlation Summary
| Measurement | Arab | Immigrants from Fiji |
| Minimum | 20.6% | 13.7% |
| Maximum | 82.1% | 100.0% |
| Range | 61.5% | 86.3% |
| Mean | 48.9% | 46.8% |
| Median | 48.5% | 47.6% |
| Interquartile 25% (IQ1) | 45.4% | 42.7% |
| Interquartile 75% (IQ3) | 52.2% | 49.1% |
| Interquartile Range (IQR) | 6.7% | 6.4% |
| Standard Deviation (Sample) | 11.4% | 13.2% |
| Standard Deviation (Population) | 11.3% | 13.0% |
Similar Demographics by Currently Married
Demographics Similar to Arabs by Currently Married
In terms of currently married, the demographic groups most similar to Arabs are Immigrants from Venezuela (47.0%, a difference of 0.0%), Albanian (47.0%, a difference of 0.0%), Immigrants from Serbia (47.0%, a difference of 0.010%), Spanish (47.0%, a difference of 0.020%), and Immigrants from Switzerland (46.9%, a difference of 0.030%).
| Demographics | Rating | Rank | Currently Married |
| Cambodians | 70.4 /100 | #148 | Good 47.0% |
| Zimbabweans | 70.1 /100 | #149 | Good 47.0% |
| Immigrants | Turkey | 70.0 /100 | #150 | Good 47.0% |
| Chileans | 69.8 /100 | #151 | Good 47.0% |
| Immigrants | Serbia | 68.8 /100 | #152 | Good 47.0% |
| Immigrants | Venezuela | 68.6 /100 | #153 | Good 47.0% |
| Albanians | 68.6 /100 | #154 | Good 47.0% |
| Arabs | 68.6 /100 | #155 | Good 47.0% |
| Spanish | 68.1 /100 | #156 | Good 47.0% |
| Immigrants | Switzerland | 67.8 /100 | #157 | Good 46.9% |
| Cherokee | 66.8 /100 | #158 | Good 46.9% |
| Iraqis | 66.4 /100 | #159 | Good 46.9% |
| Immigrants | Uzbekistan | 66.0 /100 | #160 | Good 46.9% |
| Immigrants | Southern Europe | 65.9 /100 | #161 | Good 46.9% |
| Immigrants | Nonimmigrants | 65.4 /100 | #162 | Good 46.9% |
Demographics Similar to Immigrants from Fiji by Currently Married
In terms of currently married, the demographic groups most similar to Immigrants from Fiji are Soviet Union (46.2%, a difference of 0.040%), South American (46.1%, a difference of 0.060%), Immigrants from Nepal (46.1%, a difference of 0.070%), Immigrants from France (46.2%, a difference of 0.13%), and Immigrants from Bosnia and Herzegovina (46.1%, a difference of 0.14%).
| Demographics | Rating | Rank | Currently Married |
| Immigrants | Chile | 36.8 /100 | #186 | Fair 46.4% |
| Immigrants | Peru | 35.3 /100 | #187 | Fair 46.4% |
| Colombians | 31.8 /100 | #188 | Fair 46.3% |
| Fijians | 30.3 /100 | #189 | Fair 46.3% |
| Choctaw | 29.1 /100 | #190 | Fair 46.3% |
| Immigrants | France | 27.7 /100 | #191 | Fair 46.2% |
| Soviet Union | 25.7 /100 | #192 | Fair 46.2% |
| Immigrants | Fiji | 25.0 /100 | #193 | Fair 46.2% |
| South Americans | 23.8 /100 | #194 | Fair 46.1% |
| Immigrants | Nepal | 23.7 /100 | #195 | Fair 46.1% |
| Immigrants | Bosnia and Herzegovina | 22.2 /100 | #196 | Fair 46.1% |
| Immigrants | Kuwait | 21.7 /100 | #197 | Fair 46.1% |
| Immigrants | Colombia | 21.0 /100 | #198 | Fair 46.1% |
| Immigrants | Costa Rica | 19.6 /100 | #199 | Poor 46.0% |
| Creek | 17.2 /100 | #200 | Poor 46.0% |