Albanian vs Immigrants from Denmark Divorced or Separated
COMPARE
Albanian
Immigrants from Denmark
Divorced or Separated
Divorced or Separated Comparison
Albanians
Immigrants from Denmark
11.5%
DIVORCED OR SEPARATED
99.6/ 100
METRIC RATING
76th/ 347
METRIC RANK
11.6%
DIVORCED OR SEPARATED
98.9/ 100
METRIC RATING
92nd/ 347
METRIC RANK
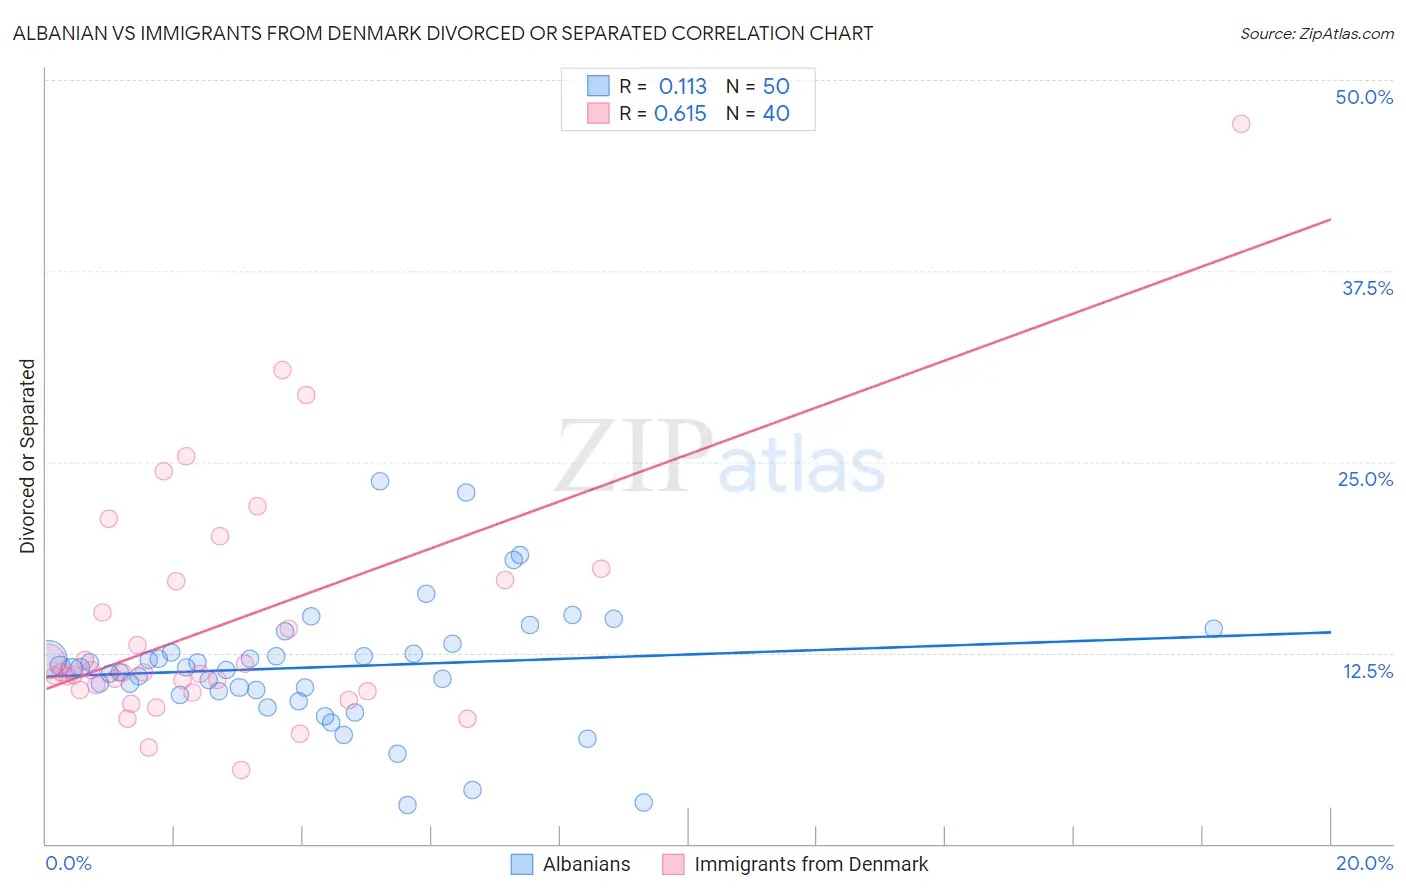
Albanian vs Immigrants from Denmark Divorced or Separated Correlation Chart
The statistical analysis conducted on geographies consisting of 193,199,268 people shows a poor positive correlation between the proportion of Albanians and percentage of population currently divorced or separated in the United States with a correlation coefficient (R) of 0.113 and weighted average of 11.5%. Similarly, the statistical analysis conducted on geographies consisting of 136,412,843 people shows a significant positive correlation between the proportion of Immigrants from Denmark and percentage of population currently divorced or separated in the United States with a correlation coefficient (R) of 0.615 and weighted average of 11.6%, a difference of 0.84%.
Divorced or Separated Correlation Summary
| Measurement | Albanian | Immigrants from Denmark |
| Minimum | 2.5% | 4.8% |
| Maximum | 23.7% | 47.1% |
| Range | 21.2% | 42.3% |
| Mean | 11.6% | 14.4% |
| Median | 11.5% | 11.2% |
| Interquartile 25% (IQ1) | 10.0% | 10.0% |
| Interquartile 75% (IQ3) | 12.5% | 17.2% |
| Interquartile Range (IQR) | 2.5% | 7.2% |
| Standard Deviation (Sample) | 4.1% | 8.1% |
| Standard Deviation (Population) | 4.1% | 8.0% |
Demographics Similar to Albanians and Immigrants from Denmark by Divorced or Separated
In terms of divorced or separated, the demographic groups most similar to Albanians are Immigrants from Northern Africa (11.5%, a difference of 0.020%), Taiwanese (11.5%, a difference of 0.10%), Immigrants from Italy (11.5%, a difference of 0.11%), Afghan (11.5%, a difference of 0.22%), and Guyanese (11.5%, a difference of 0.26%). Similarly, the demographic groups most similar to Immigrants from Denmark are Arab (11.6%, a difference of 0.0%), Immigrants from Fiji (11.6%, a difference of 0.010%), Spanish American Indian (11.6%, a difference of 0.060%), Zimbabwean (11.6%, a difference of 0.10%), and Immigrants from Southern Europe (11.6%, a difference of 0.20%).
| Demographics | Rating | Rank | Divorced or Separated |
| Taiwanese | 99.6 /100 | #74 | Exceptional 11.5% |
| Immigrants | Northern Africa | 99.6 /100 | #75 | Exceptional 11.5% |
| Albanians | 99.6 /100 | #76 | Exceptional 11.5% |
| Immigrants | Italy | 99.5 /100 | #77 | Exceptional 11.5% |
| Afghans | 99.4 /100 | #78 | Exceptional 11.5% |
| Guyanese | 99.4 /100 | #79 | Exceptional 11.5% |
| Immigrants | Switzerland | 99.4 /100 | #80 | Exceptional 11.5% |
| Russians | 99.4 /100 | #81 | Exceptional 11.5% |
| Immigrants | Romania | 99.3 /100 | #82 | Exceptional 11.5% |
| Immigrants | Bulgaria | 99.3 /100 | #83 | Exceptional 11.5% |
| Bulgarians | 99.3 /100 | #84 | Exceptional 11.5% |
| Immigrants | Albania | 99.3 /100 | #85 | Exceptional 11.5% |
| Immigrants | Latvia | 99.2 /100 | #86 | Exceptional 11.6% |
| Immigrants | Nepal | 99.2 /100 | #87 | Exceptional 11.6% |
| Immigrants | Europe | 99.2 /100 | #88 | Exceptional 11.6% |
| Immigrants | Southern Europe | 99.1 /100 | #89 | Exceptional 11.6% |
| Zimbabweans | 99.0 /100 | #90 | Exceptional 11.6% |
| Spanish American Indians | 99.0 /100 | #91 | Exceptional 11.6% |
| Immigrants | Denmark | 98.9 /100 | #92 | Exceptional 11.6% |
| Arabs | 98.9 /100 | #93 | Exceptional 11.6% |
| Immigrants | Fiji | 98.9 /100 | #94 | Exceptional 11.6% |