Albanian vs Belizean Average Family Size
COMPARE
Albanian
Belizean
Average Family Size
Average Family Size Comparison
Albanians
Belizeans
3.17
AVERAGE FAMILY SIZE
1.5/ 100
METRIC RATING
257th/ 347
METRIC RANK
3.39
AVERAGE FAMILY SIZE
100.0/ 100
METRIC RATING
40th/ 347
METRIC RANK
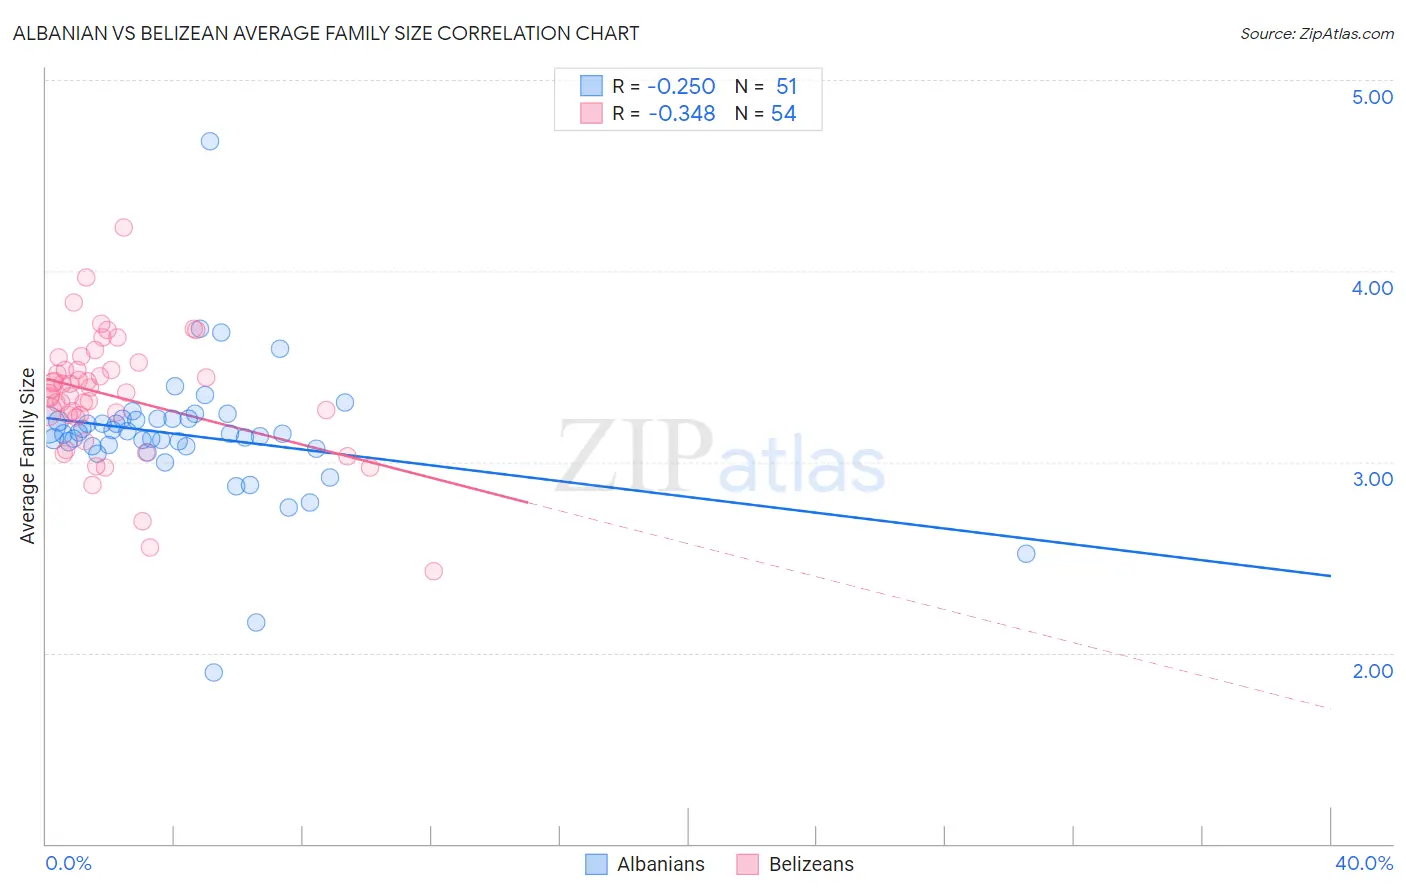
Albanian vs Belizean Average Family Size Correlation Chart
The statistical analysis conducted on geographies consisting of 193,186,402 people shows a weak negative correlation between the proportion of Albanians and average family size in the United States with a correlation coefficient (R) of -0.250 and weighted average of 3.17. Similarly, the statistical analysis conducted on geographies consisting of 144,152,249 people shows a mild negative correlation between the proportion of Belizeans and average family size in the United States with a correlation coefficient (R) of -0.348 and weighted average of 3.39, a difference of 6.9%.
Average Family Size Correlation Summary
| Measurement | Albanian | Belizean |
| Minimum | 1.90 | 2.43 |
| Maximum | 4.68 | 4.23 |
| Range | 2.78 | 1.80 |
| Mean | 3.14 | 3.34 |
| Median | 3.15 | 3.37 |
| Interquartile 25% (IQ1) | 3.08 | 3.24 |
| Interquartile 75% (IQ3) | 3.22 | 3.48 |
| Interquartile Range (IQR) | 0.15 | 0.24 |
| Standard Deviation (Sample) | 0.37 | 0.32 |
| Standard Deviation (Population) | 0.37 | 0.32 |
Similar Demographics by Average Family Size
Demographics Similar to Albanians by Average Family Size
In terms of average family size, the demographic groups most similar to Albanians are Immigrants from Kazakhstan (3.17, a difference of 0.020%), Cape Verdean (3.17, a difference of 0.050%), Turkish (3.16, a difference of 0.050%), Potawatomi (3.16, a difference of 0.050%), and Immigrants from Hungary (3.17, a difference of 0.060%).
| Demographics | Rating | Rank | Average Family Size |
| Puget Sound Salish | 1.9 /100 | #250 | Tragic 3.17 |
| Immigrants | Spain | 1.8 /100 | #251 | Tragic 3.17 |
| Immigrants | Saudi Arabia | 1.7 /100 | #252 | Tragic 3.17 |
| South Africans | 1.7 /100 | #253 | Tragic 3.17 |
| Immigrants | Hungary | 1.7 /100 | #254 | Tragic 3.17 |
| Cape Verdeans | 1.6 /100 | #255 | Tragic 3.17 |
| Immigrants | Kazakhstan | 1.5 /100 | #256 | Tragic 3.17 |
| Albanians | 1.5 /100 | #257 | Tragic 3.17 |
| Turks | 1.3 /100 | #258 | Tragic 3.16 |
| Potawatomi | 1.3 /100 | #259 | Tragic 3.16 |
| Immigrants | Albania | 1.3 /100 | #260 | Tragic 3.16 |
| Immigrants | North Macedonia | 1.3 /100 | #261 | Tragic 3.16 |
| Immigrants | Russia | 1.3 /100 | #262 | Tragic 3.16 |
| Immigrants | Bulgaria | 1.0 /100 | #263 | Tragic 3.16 |
| Americans | 1.0 /100 | #264 | Tragic 3.16 |
Demographics Similar to Belizeans by Average Family Size
In terms of average family size, the demographic groups most similar to Belizeans are Immigrants from Haiti (3.39, a difference of 0.12%), Marshallese (3.38, a difference of 0.17%), Immigrants from Belize (3.39, a difference of 0.20%), Immigrants from Vietnam (3.38, a difference of 0.23%), and Immigrants from Philippines (3.37, a difference of 0.33%).
| Demographics | Rating | Rank | Average Family Size |
| Hawaiians | 100.0 /100 | #33 | Exceptional 3.41 |
| Hispanics or Latinos | 100.0 /100 | #34 | Exceptional 3.41 |
| Guatemalans | 100.0 /100 | #35 | Exceptional 3.40 |
| Immigrants | Guyana | 100.0 /100 | #36 | Exceptional 3.40 |
| Guyanese | 100.0 /100 | #37 | Exceptional 3.40 |
| Immigrants | Belize | 100.0 /100 | #38 | Exceptional 3.39 |
| Immigrants | Haiti | 100.0 /100 | #39 | Exceptional 3.39 |
| Belizeans | 100.0 /100 | #40 | Exceptional 3.39 |
| Marshallese | 100.0 /100 | #41 | Exceptional 3.38 |
| Immigrants | Vietnam | 100.0 /100 | #42 | Exceptional 3.38 |
| Immigrants | Philippines | 100.0 /100 | #43 | Exceptional 3.37 |
| Alaska Natives | 100.0 /100 | #44 | Exceptional 3.37 |
| Shoshone | 100.0 /100 | #45 | Exceptional 3.37 |
| Haitians | 100.0 /100 | #46 | Exceptional 3.37 |
| Vietnamese | 100.0 /100 | #47 | Exceptional 3.37 |