Alaskan Athabascan vs Immigrants from Kenya Single Father Households
COMPARE
Alaskan Athabascan
Immigrants from Kenya
Single Father Households
Single Father Households Comparison
Alaskan Athabascans
Immigrants from Kenya
3.4%
SINGLE FATHER HOUSEHOLDS
0.0/ 100
METRIC RATING
339th/ 347
METRIC RANK
2.4%
SINGLE FATHER HOUSEHOLDS
20.3/ 100
METRIC RATING
208th/ 347
METRIC RANK
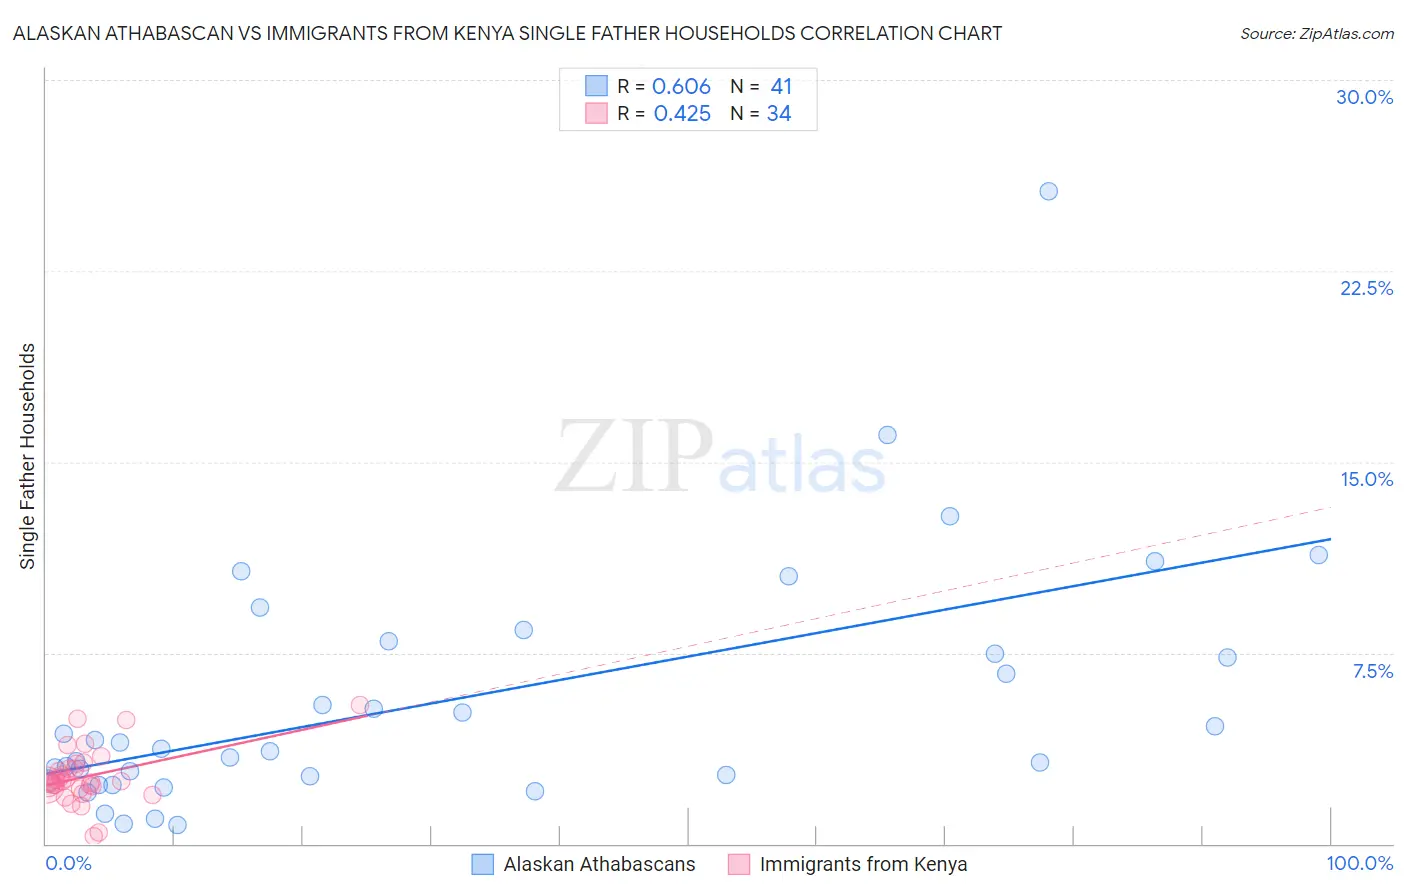
Alaskan Athabascan vs Immigrants from Kenya Single Father Households Correlation Chart
The statistical analysis conducted on geographies consisting of 45,717,471 people shows a significant positive correlation between the proportion of Alaskan Athabascans and percentage of single father households in the United States with a correlation coefficient (R) of 0.606 and weighted average of 3.4%. Similarly, the statistical analysis conducted on geographies consisting of 217,370,278 people shows a moderate positive correlation between the proportion of Immigrants from Kenya and percentage of single father households in the United States with a correlation coefficient (R) of 0.425 and weighted average of 2.4%, a difference of 40.8%.
Single Father Households Correlation Summary
| Measurement | Alaskan Athabascan | Immigrants from Kenya |
| Minimum | 0.71% | 0.28% |
| Maximum | 25.6% | 5.4% |
| Range | 24.9% | 5.2% |
| Mean | 5.6% | 2.6% |
| Median | 3.7% | 2.4% |
| Interquartile 25% (IQ1) | 2.6% | 2.2% |
| Interquartile 75% (IQ3) | 7.7% | 3.0% |
| Interquartile Range (IQR) | 5.2% | 0.71% |
| Standard Deviation (Sample) | 4.9% | 1.1% |
| Standard Deviation (Population) | 4.8% | 1.1% |
Similar Demographics by Single Father Households
Demographics Similar to Alaskan Athabascans by Single Father Households
In terms of single father households, the demographic groups most similar to Alaskan Athabascans are Sioux (3.3%, a difference of 1.5%), Pueblo (3.3%, a difference of 2.1%), Paiute (3.3%, a difference of 2.4%), Colville (3.3%, a difference of 2.4%), and Yuman (3.3%, a difference of 2.5%).
| Demographics | Rating | Rank | Single Father Households |
| Yaqui | 0.0 /100 | #332 | Tragic 3.2% |
| Natives/Alaskans | 0.0 /100 | #333 | Tragic 3.2% |
| Yuman | 0.0 /100 | #334 | Tragic 3.3% |
| Colville | 0.0 /100 | #335 | Tragic 3.3% |
| Paiute | 0.0 /100 | #336 | Tragic 3.3% |
| Pueblo | 0.0 /100 | #337 | Tragic 3.3% |
| Sioux | 0.0 /100 | #338 | Tragic 3.3% |
| Alaskan Athabascans | 0.0 /100 | #339 | Tragic 3.4% |
| Alaska Natives | 0.0 /100 | #340 | Tragic 3.5% |
| Crow | 0.0 /100 | #341 | Tragic 3.5% |
| Tohono O'odham | 0.0 /100 | #342 | Tragic 3.8% |
| Pima | 0.0 /100 | #343 | Tragic 4.2% |
| Yakama | 0.0 /100 | #344 | Tragic 4.2% |
| Menominee | 0.0 /100 | #345 | Tragic 4.2% |
| Inupiat | 0.0 /100 | #346 | Tragic 4.9% |
Demographics Similar to Immigrants from Kenya by Single Father Households
In terms of single father households, the demographic groups most similar to Immigrants from Kenya are Immigrants from Peru (2.4%, a difference of 0.12%), Immigrants from Costa Rica (2.4%, a difference of 0.13%), Immigrants from Nigeria (2.4%, a difference of 0.18%), Finnish (2.4%, a difference of 0.23%), and White/Caucasian (2.4%, a difference of 0.25%).
| Demographics | Rating | Rank | Single Father Households |
| Immigrants | Uganda | 26.0 /100 | #201 | Fair 2.4% |
| German Russians | 25.7 /100 | #202 | Fair 2.4% |
| French Canadians | 24.7 /100 | #203 | Fair 2.4% |
| Ecuadorians | 24.5 /100 | #204 | Fair 2.4% |
| Immigrants | Afghanistan | 24.2 /100 | #205 | Fair 2.4% |
| Koreans | 24.1 /100 | #206 | Fair 2.4% |
| Whites/Caucasians | 22.6 /100 | #207 | Fair 2.4% |
| Immigrants | Kenya | 20.3 /100 | #208 | Fair 2.4% |
| Immigrants | Peru | 19.3 /100 | #209 | Poor 2.4% |
| Immigrants | Costa Rica | 19.2 /100 | #210 | Poor 2.4% |
| Immigrants | Nigeria | 18.7 /100 | #211 | Poor 2.4% |
| Finns | 18.3 /100 | #212 | Poor 2.4% |
| Norwegians | 17.1 /100 | #213 | Poor 2.4% |
| Ethiopians | 16.6 /100 | #214 | Poor 2.4% |
| Immigrants | South Eastern Asia | 15.9 /100 | #215 | Poor 2.4% |