Alaskan Athabascan vs Ethiopian Births to Unmarried Women

COMPARE

Alaskan Athabascan
Race
Ancestry
AfghanAfricanAlaska NativeAlaskan AthabascanAlbanianAleutAlsatianAmericanApacheArabArapahoArgentineanArmenianAssyrian/Chaldean/SyriacAustralianAustrianBahamianBangladeshiBarbadianBasqueBelgianBelizeanBermudanBhutaneseBlackfeetBolivianBrazilianBritishBritish West IndianBulgarianBurmeseCajunCambodianCanadianCape VerdeanCarpatho RusynCelticCentral AmericanCentral American IndianCherokeeCheyenneChickasawChileanChineseChippewaChoctawColombianColvilleComancheCosta RicanCreeCreekCroatianCrowCubanCypriotCzechCzechoslovakianDanishDelawareDominicanDutchDutch West IndianEastern EuropeanEcuadorianEgyptianEnglishEstonianEuropeanFijianFilipinoFinnishFrenchFrench American IndianFrench CanadianGermanGerman RussianGhanaianGreekGuamanian/ChamorroGuatemalanGuyaneseHaitianHmongHonduranHopiHoumaHungarianIcelanderIndian (Asian)IndonesianInupiatIranianIraqiIrishIroquoisIsraeliItalianJamaicanJapaneseJordanianKenyanKiowaKoreanLaotianLatvianLebaneseLiberianLithuanianLumbeeLuxembourgerMacedonianMalaysianMalteseMarshalleseMenomineeMexicanMexican American IndianMongolianMoroccanNative HawaiianNavajoNepaleseNew ZealanderNicaraguanNigerianNorthern EuropeanNorwegianOkinawanOsageOttawaPaiutePakistaniPalestinianPanamanianParaguayanPennsylvania GermanPeruvianPimaPolishPortuguesePotawatomiPuebloPuerto RicanPuget Sound SalishRomanianRussianSalvadoranSamoanScandinavianScotch-IrishScottishSeminoleSenegaleseSerbianShoshoneSierra LeoneanSiouxSlavicSlovakSloveneSomaliSouth AfricanSouth AmericanSouth American IndianSoviet UnionSpaniardSpanishSpanish AmericanSpanish American IndianSri LankanSubsaharan AfricanSudaneseSwedishSwissSyrianTaiwaneseThaiTlingit-HaidaTohono O'OdhamTonganTrinidadian and TobagonianTsimshianTurkishU.S. Virgin IslanderUgandanUkrainianUruguayanUteVenezuelanVietnameseWelshWest IndianYakamaYaquiYugoslavianYumanYup'ikZimbabwean
Immigration
NonimmigrantsImmigrantsAfghanistanAfricaAlbaniaArgentinaArmeniaAsiaAustraliaAustriaBahamasBangladeshBarbadosBelarusBelgiumBelizeBoliviaBosnia and HerzegovinaBrazilBulgariaBurma/MyanmarCabo VerdeCambodiaCameroonCanadaCaribbeanCentral AmericaChileChinaColombiaCongoCosta RicaCroatiaCubaCzechoslovakiaDenmarkDominicaDominican RepublicEastern AfricaEastern AsiaEastern EuropeEcuadorEgyptEl SalvadorEnglandEritreaEthiopiaEuropeFijiFranceGermanyGhanaGreeceGrenadaGuatemalaGuyanaHaitiHondurasHong KongHungaryIndiaIndonesiaIranIraqIrelandIsraelItalyJamaicaJapanJordanKazakhstanKenyaKoreaKuwaitLaosLatin AmericaLatviaLebanonLiberiaLithuaniaMalaysiaMexicoMicronesiaMiddle AfricaMoldovaMoroccoNepalNetherlandsNicaraguaNigeriaNorth AmericaNorth MacedoniaNorthern AfricaNorthern EuropeNorwayOceaniaPakistanPanamaPeruPhilippinesPolandPortugalRomaniaRussiaSaudi ArabiaScotlandSenegalSerbiaSierra LeoneSingaporeSomaliaSouth AfricaSouth AmericaSouth Central AsiaSouth Eastern AsiaSouthern EuropeSpainSri LankaSt. Vincent and the GrenadinesSudanSwedenSwitzerlandSyriaTaiwanThailandTrinidad and TobagoTurkeyUgandaUkraineUruguayUzbekistanVenezuelaVietnamWest IndiesWestern AfricaWestern AsiaWestern EuropeYemenZaireZimbabweAzores
Ethiopian
Race
Ancestry
AfghanAfricanAlaska NativeAlbanianAleutAlsatianAmericanApacheArabArapahoArgentineanArmenianAssyrian/Chaldean/SyriacAustralianAustrianBahamianBangladeshiBarbadianBasqueBelgianBelizeanBermudanBhutaneseBlackfeetBolivianBrazilianBritishBritish West IndianBulgarianBurmeseCajunCambodianCanadianCape VerdeanCarpatho RusynCelticCentral AmericanCentral American IndianCherokeeCheyenneChickasawChileanChineseChippewaChoctawColombianColvilleComancheCosta RicanCreeCreekCroatianCrowCubanCypriotCzechCzechoslovakianDanishDelawareDominicanDutchDutch West IndianEastern EuropeanEcuadorianEgyptianEnglishEstonianEthiopianEuropeanFijianFilipinoFinnishFrenchFrench American IndianFrench CanadianGermanGerman RussianGhanaianGreekGuamanian/ChamorroGuatemalanGuyaneseHaitianHmongHonduranHopiHoumaHungarianIcelanderIndian (Asian)IndonesianInupiatIranianIraqiIrishIroquoisIsraeliItalianJamaicanJapaneseJordanianKenyanKiowaKoreanLaotianLatvianLebaneseLiberianLithuanianLumbeeLuxembourgerMacedonianMalaysianMalteseMarshalleseMenomineeMexicanMexican American IndianMongolianMoroccanNative HawaiianNavajoNepaleseNew ZealanderNicaraguanNigerianNorthern EuropeanNorwegianOkinawanOsageOttawaPaiutePakistaniPalestinianPanamanianParaguayanPennsylvania GermanPeruvianPimaPolishPortuguesePotawatomiPuebloPuerto RicanPuget Sound SalishRomanianRussianSalvadoranSamoanScandinavianScotch-IrishScottishSeminoleSenegaleseSerbianShoshoneSierra LeoneanSiouxSlavicSlovakSloveneSomaliSouth AfricanSouth AmericanSouth American IndianSoviet UnionSpaniardSpanishSpanish AmericanSpanish American IndianSri LankanSubsaharan AfricanSudaneseSwedishSwissSyrianTaiwaneseThaiTlingit-HaidaTohono O'OdhamTonganTrinidadian and TobagonianTsimshianTurkishU.S. Virgin IslanderUgandanUkrainianUruguayanUteVenezuelanVietnameseWelshWest IndianYakamaYaquiYugoslavianYumanYup'ikZimbabwean
Immigration
NonimmigrantsImmigrantsAfghanistanAfricaAlbaniaArgentinaArmeniaAsiaAustraliaAustriaBahamasBangladeshBarbadosBelarusBelgiumBelizeBoliviaBosnia and HerzegovinaBrazilBulgariaBurma/MyanmarCabo VerdeCambodiaCameroonCanadaCaribbeanCentral AmericaChileChinaColombiaCongoCosta RicaCroatiaCubaCzechoslovakiaDenmarkDominicaDominican RepublicEastern AfricaEastern AsiaEastern EuropeEcuadorEgyptEl SalvadorEnglandEritreaEthiopiaEuropeFijiFranceGermanyGhanaGreeceGrenadaGuatemalaGuyanaHaitiHondurasHong KongHungaryIndiaIndonesiaIranIraqIrelandIsraelItalyJamaicaJapanJordanKazakhstanKenyaKoreaKuwaitLaosLatin AmericaLatviaLebanonLiberiaLithuaniaMalaysiaMexicoMicronesiaMiddle AfricaMoldovaMoroccoNepalNetherlandsNicaraguaNigeriaNorth AmericaNorth MacedoniaNorthern AfricaNorthern EuropeNorwayOceaniaPakistanPanamaPeruPhilippinesPolandPortugalRomaniaRussiaSaudi ArabiaScotlandSenegalSerbiaSierra LeoneSingaporeSomaliaSouth AfricaSouth AmericaSouth Central AsiaSouth Eastern AsiaSouthern EuropeSpainSri LankaSt. Vincent and the GrenadinesSudanSwedenSwitzerlandSyriaTaiwanThailandTrinidad and TobagoTurkeyUgandaUkraineUruguayUzbekistanVenezuelaVietnamWest IndiesWestern AfricaWestern AsiaWestern EuropeYemenZaireZimbabweAzores
Births to Unmarried Women
Income
Poverty
Unemployment
Labor Participation
Family Structure
Vehicle Availability
Education Level
Disability

Births to Unmarried Women Comparison

Alaskan Athabascans

Ethiopians

Tragic
Exceptional
37.7%
BIRTHS TO UNMARRIED WOMEN
0.0/ 100
METRIC RATING
289th/ 347
METRIC RANK
29.8%
BIRTHS TO UNMARRIED WOMEN
91.9/ 100
METRIC RATING
115th/ 347
METRIC RANK

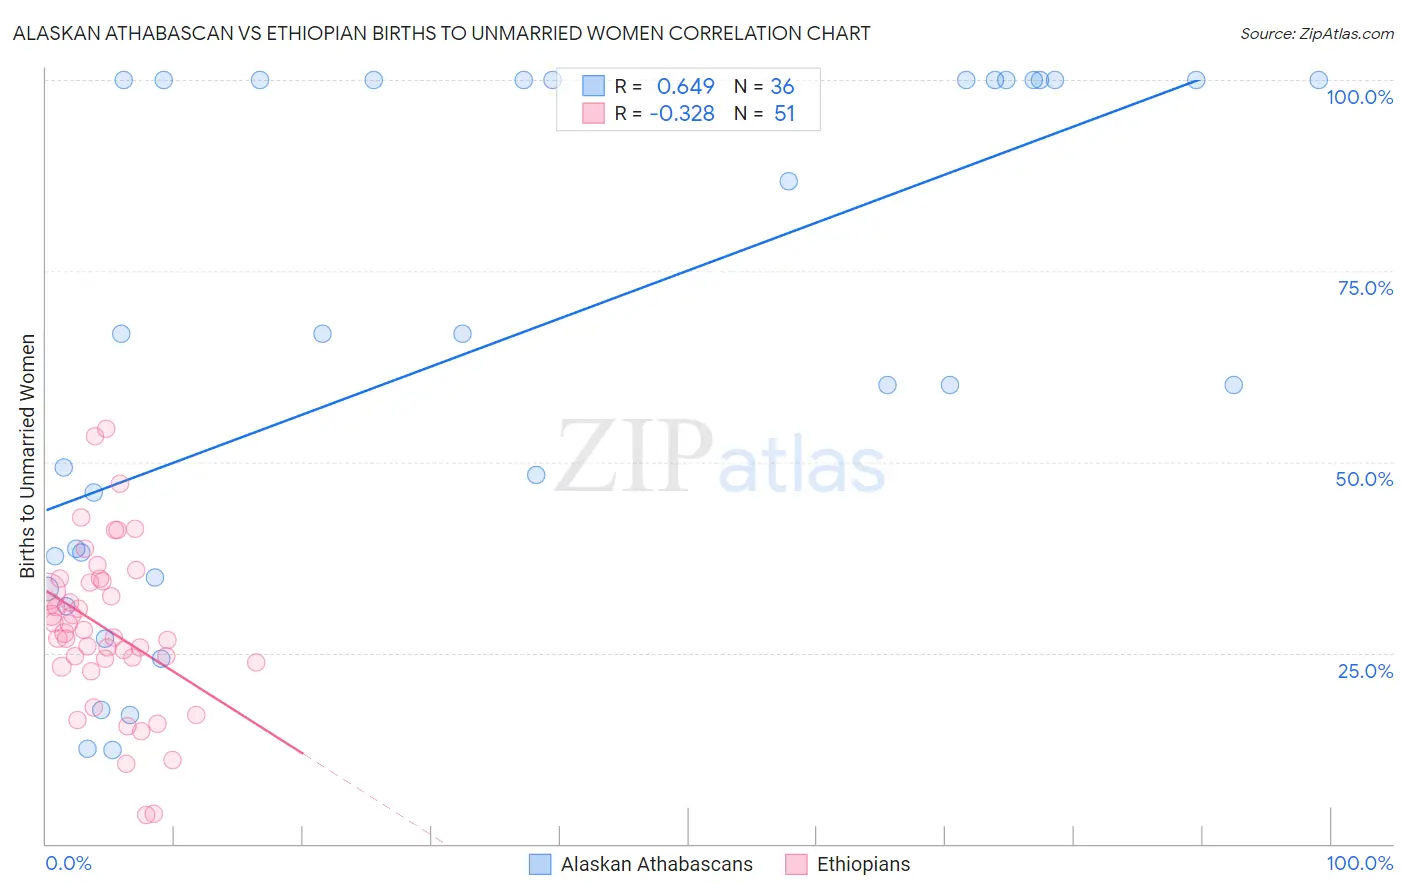
Alaskan Athabascan vs Ethiopian Births to Unmarried Women Correlation Chart

The statistical analysis conducted on geographies consisting of 44,775,598 people shows a significant positive correlation between the proportion of Alaskan Athabascans and percentage of births to unmarried women in the United States with a correlation coefficient (R) of 0.649 and weighted average of 37.7%. Similarly, the statistical analysis conducted on geographies consisting of 215,740,529 people shows a mild negative correlation between the proportion of Ethiopians and percentage of births to unmarried women in the United States with a correlation coefficient (R) of -0.328 and weighted average of 29.8%, a difference of 26.4%.
Alaskan Athabascan vs Ethiopian Births to Unmarried Women

Births to Unmarried Women Correlation Summary

MeasurementAlaskan AthabascanEthiopian
Minimum12.2%3.7%
Maximum100.0%54.3%
Range87.8%50.6%
Mean64.8%28.2%
Median63.4%27.6%
Interquartile 25% (IQ1)36.2%23.8%
Interquartile 75% (IQ3)100.0%34.4%
Interquartile Range (IQR)63.8%10.6%
Standard Deviation (Sample)32.5%10.7%
Standard Deviation (Population)32.1%10.6%

Similar Demographics by Births to Unmarried Women

Demographics Similar to Alaskan Athabascans by Births to Unmarried Women

In terms of births to unmarried women, the demographic groups most similar to Alaskan Athabascans are Hispanic or Latino (37.8%, a difference of 0.14%), Immigrants from Liberia (37.6%, a difference of 0.23%), Creek (37.6%, a difference of 0.40%), Seminole (37.9%, a difference of 0.48%), and Blackfeet (37.9%, a difference of 0.52%).
DemographicsRating | RankBirths to Unmarried Women
Liberians
0.0
/100
|
#282
Tragic
37.4%
Spanish American Indians
0.0
/100
|
#283
Tragic
37.4%
Immigrants | Central America
0.0
/100
|
#284
Tragic
37.4%
Immigrants | Mexico
0.0
/100
|
#285
Tragic
37.5%
Immigrants | Guatemala
0.0
/100
|
#286
Tragic
37.5%
Creek
0.0
/100
|
#287
Tragic
37.6%
Immigrants | Liberia
0.0
/100
|
#288
Tragic
37.6%
Alaskan Athabascans
0.0
/100
|
#289
Tragic
37.7%
Hispanics or Latinos
0.0
/100
|
#290
Tragic
37.8%
Seminole
0.0
/100
|
#291
Tragic
37.9%
Blackfeet
0.0
/100
|
#292
Tragic
37.9%
Immigrants | Nicaragua
0.0
/100
|
#293
Tragic
38.0%
British West Indians
0.0
/100
|
#294
Tragic
38.0%
Iroquois
0.0
/100
|
#295
Tragic
38.2%
Alaska Natives
0.0
/100
|
#296
Tragic
38.3%

Demographics Similar to Ethiopians by Births to Unmarried Women

In terms of births to unmarried women, the demographic groups most similar to Ethiopians are Immigrants from Italy (29.9%, a difference of 0.080%), Immigrants from Croatia (29.8%, a difference of 0.22%), Scandinavian (29.8%, a difference of 0.28%), Immigrants from Netherlands (29.9%, a difference of 0.29%), and Immigrants from Norway (29.9%, a difference of 0.31%).
DemographicsRating | RankBirths to Unmarried Women
Paraguayans
93.5
/100
|
#108
Exceptional
29.7%
Greeks
93.4
/100
|
#109
Exceptional
29.7%
Immigrants | Ethiopia
93.4
/100
|
#110
Exceptional
29.7%
Immigrants | Hungary
93.0
/100
|
#111
Exceptional
29.7%
Basques
93.0
/100
|
#112
Exceptional
29.7%
Scandinavians
92.7
/100
|
#113
Exceptional
29.8%
Immigrants | Croatia
92.6
/100
|
#114
Exceptional
29.8%
Ethiopians
91.9
/100
|
#115
Exceptional
29.8%
Immigrants | Italy
91.7
/100
|
#116
Exceptional
29.9%
Immigrants | Netherlands
91.1
/100
|
#117
Exceptional
29.9%
Immigrants | Norway
91.0
/100
|
#118
Exceptional
29.9%
Argentineans
90.5
/100
|
#119
Exceptional
30.0%
Ugandans
89.2
/100
|
#120
Excellent
30.1%
Koreans
88.9
/100
|
#121
Excellent
30.1%
Immigrants | Argentina
88.7
/100
|
#122
Excellent
30.1%