Afghan vs Hmong Family Households with Children

COMPARE

Afghan
Race
Ancestry
AfghanAfricanAlaska NativeAlaskan AthabascanAlbanianAleutAlsatianAmericanApacheArabArapahoArgentineanArmenianAssyrian/Chaldean/SyriacAustralianAustrianBahamianBangladeshiBarbadianBasqueBelgianBelizeanBermudanBhutaneseBlackfeetBolivianBrazilianBritishBritish West IndianBulgarianBurmeseCajunCambodianCanadianCape VerdeanCarpatho RusynCelticCentral AmericanCentral American IndianCherokeeCheyenneChickasawChileanChineseChippewaChoctawColombianColvilleComancheCosta RicanCreeCreekCroatianCrowCubanCypriotCzechCzechoslovakianDanishDelawareDominicanDutchDutch West IndianEastern EuropeanEcuadorianEgyptianEnglishEstonianEthiopianEuropeanFijianFilipinoFinnishFrenchFrench American IndianFrench CanadianGermanGerman RussianGhanaianGreekGuamanian/ChamorroGuatemalanGuyaneseHaitianHonduranHopiHoumaHungarianIcelanderIndian (Asian)IndonesianInupiatIranianIraqiIrishIroquoisIsraeliItalianJamaicanJapaneseJordanianKenyanKiowaKoreanLaotianLatvianLebaneseLiberianLithuanianLumbeeLuxembourgerMacedonianMalaysianMalteseMarshalleseMenomineeMexicanMexican American IndianMongolianMoroccanNative HawaiianNavajoNepaleseNew ZealanderNicaraguanNigerianNorthern EuropeanNorwegianOkinawanOsageOttawaPaiutePakistaniPalestinianPanamanianParaguayanPennsylvania GermanPeruvianPimaPolishPortuguesePotawatomiPuebloPuerto RicanPuget Sound SalishRomanianRussianSalvadoranSamoanScandinavianScotch-IrishScottishSeminoleSenegaleseSerbianShoshoneSierra LeoneanSiouxSlavicSlovakSloveneSomaliSouth AfricanSouth AmericanSouth American IndianSoviet UnionSpaniardSpanishSpanish AmericanSpanish American IndianSri LankanSubsaharan AfricanSudaneseSwedishSwissSyrianTaiwaneseThaiTlingit-HaidaTohono O'OdhamTonganTrinidadian and TobagonianTsimshianTurkishU.S. Virgin IslanderUgandanUkrainianUruguayanUteVenezuelanVietnameseWelshWest IndianYakamaYaquiYugoslavianYumanYup'ikZimbabwean
Immigration
NonimmigrantsImmigrantsAfghanistanAfricaAlbaniaArgentinaArmeniaAsiaAustraliaAustriaBahamasBangladeshBarbadosBelarusBelgiumBelizeBoliviaBosnia and HerzegovinaBrazilBulgariaBurma/MyanmarCabo VerdeCambodiaCameroonCanadaCaribbeanCentral AmericaChileChinaColombiaCongoCosta RicaCroatiaCubaCzechoslovakiaDenmarkDominicaDominican RepublicEastern AfricaEastern AsiaEastern EuropeEcuadorEgyptEl SalvadorEnglandEritreaEthiopiaEuropeFijiFranceGermanyGhanaGreeceGrenadaGuatemalaGuyanaHaitiHondurasHong KongHungaryIndiaIndonesiaIranIraqIrelandIsraelItalyJamaicaJapanJordanKazakhstanKenyaKoreaKuwaitLaosLatin AmericaLatviaLebanonLiberiaLithuaniaMalaysiaMexicoMicronesiaMiddle AfricaMoldovaMoroccoNepalNetherlandsNicaraguaNigeriaNorth AmericaNorth MacedoniaNorthern AfricaNorthern EuropeNorwayOceaniaPakistanPanamaPeruPhilippinesPolandPortugalRomaniaRussiaSaudi ArabiaScotlandSenegalSerbiaSierra LeoneSingaporeSomaliaSouth AfricaSouth AmericaSouth Central AsiaSouth Eastern AsiaSouthern EuropeSpainSri LankaSt. Vincent and the GrenadinesSudanSwedenSwitzerlandSyriaTaiwanThailandTrinidad and TobagoTurkeyUgandaUkraineUruguayUzbekistanVenezuelaVietnamWest IndiesWestern AfricaWestern AsiaWestern EuropeYemenZaireZimbabweAzores
Hmong
Race
Ancestry
AfricanAlaska NativeAlaskan AthabascanAlbanianAleutAlsatianAmericanApacheArabArapahoArgentineanArmenianAssyrian/Chaldean/SyriacAustralianAustrianBahamianBangladeshiBarbadianBasqueBelgianBelizeanBermudanBhutaneseBlackfeetBolivianBrazilianBritishBritish West IndianBulgarianBurmeseCajunCambodianCanadianCape VerdeanCarpatho RusynCelticCentral AmericanCentral American IndianCherokeeCheyenneChickasawChileanChineseChippewaChoctawColombianColvilleComancheCosta RicanCreeCreekCroatianCrowCubanCypriotCzechCzechoslovakianDanishDelawareDominicanDutchDutch West IndianEastern EuropeanEcuadorianEgyptianEnglishEstonianEthiopianEuropeanFijianFilipinoFinnishFrenchFrench American IndianFrench CanadianGermanGerman RussianGhanaianGreekGuamanian/ChamorroGuatemalanGuyaneseHaitianHmongHonduranHopiHoumaHungarianIcelanderIndian (Asian)IndonesianInupiatIranianIraqiIrishIroquoisIsraeliItalianJamaicanJapaneseJordanianKenyanKiowaKoreanLaotianLatvianLebaneseLiberianLithuanianLumbeeLuxembourgerMacedonianMalaysianMalteseMarshalleseMenomineeMexicanMexican American IndianMongolianMoroccanNative HawaiianNavajoNepaleseNew ZealanderNicaraguanNigerianNorthern EuropeanNorwegianOkinawanOsageOttawaPaiutePakistaniPalestinianPanamanianParaguayanPennsylvania GermanPeruvianPimaPolishPortuguesePotawatomiPuebloPuerto RicanPuget Sound SalishRomanianRussianSalvadoranSamoanScandinavianScotch-IrishScottishSeminoleSenegaleseSerbianShoshoneSierra LeoneanSiouxSlavicSlovakSloveneSomaliSouth AfricanSouth AmericanSouth American IndianSoviet UnionSpaniardSpanishSpanish AmericanSpanish American IndianSri LankanSubsaharan AfricanSudaneseSwedishSwissSyrianTaiwaneseThaiTlingit-HaidaTohono O'OdhamTonganTrinidadian and TobagonianTsimshianTurkishU.S. Virgin IslanderUgandanUkrainianUruguayanUteVenezuelanVietnameseWelshWest IndianYakamaYaquiYugoslavianYumanYup'ikZimbabwean
Immigration
NonimmigrantsImmigrantsAfghanistanAfricaAlbaniaArgentinaArmeniaAsiaAustraliaAustriaBahamasBangladeshBarbadosBelarusBelgiumBelizeBoliviaBosnia and HerzegovinaBrazilBulgariaBurma/MyanmarCabo VerdeCambodiaCameroonCanadaCaribbeanCentral AmericaChileChinaColombiaCongoCosta RicaCroatiaCubaCzechoslovakiaDenmarkDominicaDominican RepublicEastern AfricaEastern AsiaEastern EuropeEcuadorEgyptEl SalvadorEnglandEritreaEthiopiaEuropeFijiFranceGermanyGhanaGreeceGrenadaGuatemalaGuyanaHaitiHondurasHong KongHungaryIndiaIndonesiaIranIraqIrelandIsraelItalyJamaicaJapanJordanKazakhstanKenyaKoreaKuwaitLaosLatin AmericaLatviaLebanonLiberiaLithuaniaMalaysiaMexicoMicronesiaMiddle AfricaMoldovaMoroccoNepalNetherlandsNicaraguaNigeriaNorth AmericaNorth MacedoniaNorthern AfricaNorthern EuropeNorwayOceaniaPakistanPanamaPeruPhilippinesPolandPortugalRomaniaRussiaSaudi ArabiaScotlandSenegalSerbiaSierra LeoneSingaporeSomaliaSouth AfricaSouth AmericaSouth Central AsiaSouth Eastern AsiaSouthern EuropeSpainSri LankaSt. Vincent and the GrenadinesSudanSwedenSwitzerlandSyriaTaiwanThailandTrinidad and TobagoTurkeyUgandaUkraineUruguayUzbekistanVenezuelaVietnamWest IndiesWestern AfricaWestern AsiaWestern EuropeYemenZaireZimbabweAzores
Family Households with Children
Income
Poverty
Unemployment
Labor Participation
Family Structure
Vehicle Availability
Education Level
Disability

Family Households with Children Comparison

Afghans

Hmong

Exceptional
Exceptional
30.2%
FAMILY HOUSEHOLDS WITH CHILDREN
100.0/ 100
METRIC RATING
13th/ 347
METRIC RANK
28.6%
FAMILY HOUSEHOLDS WITH CHILDREN
99.9/ 100
METRIC RATING
60th/ 347
METRIC RANK

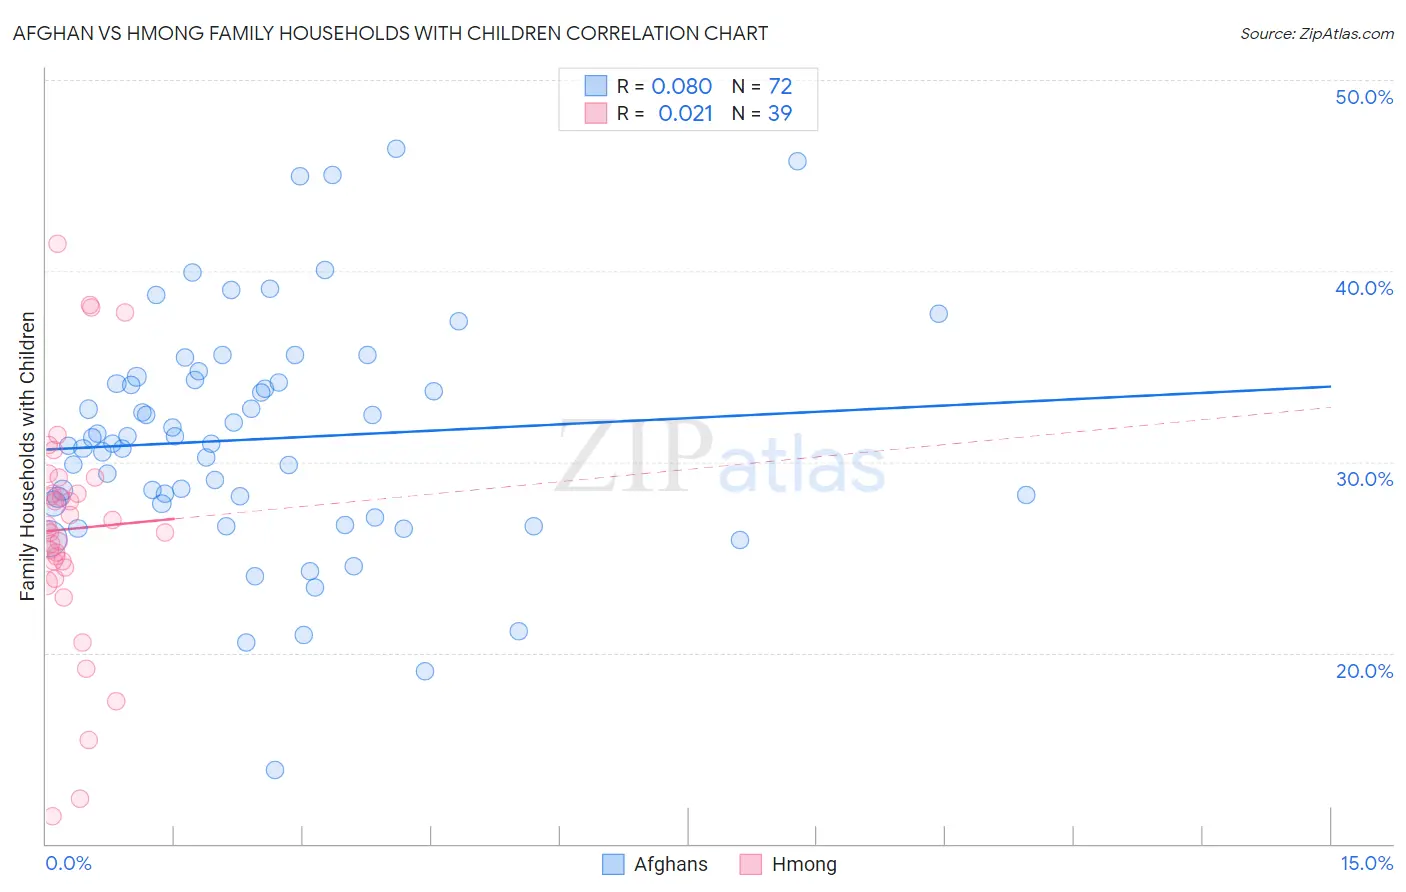
Afghan vs Hmong Family Households with Children Correlation Chart

The statistical analysis conducted on geographies consisting of 148,820,145 people shows a slight positive correlation between the proportion of Afghans and percentage of family households with children in the United States with a correlation coefficient (R) of 0.080 and weighted average of 30.2%. Similarly, the statistical analysis conducted on geographies consisting of 24,678,157 people shows no correlation between the proportion of Hmong and percentage of family households with children in the United States with a correlation coefficient (R) of 0.021 and weighted average of 28.6%, a difference of 5.5%.
Afghan vs Hmong Family Households with Children

Family Households with Children Correlation Summary

MeasurementAfghanHmong
Minimum13.8%11.4%
Maximum46.4%41.4%
Range32.5%30.0%
Mean31.2%26.5%
Median31.0%26.4%
Interquartile 25% (IQ1)27.8%24.5%
Interquartile 75% (IQ3)34.2%29.2%
Interquartile Range (IQR)6.4%4.7%
Standard Deviation (Sample)6.1%6.3%
Standard Deviation (Population)6.1%6.2%

Similar Demographics by Family Households with Children

Demographics Similar to Afghans by Family Households with Children

In terms of family households with children, the demographic groups most similar to Afghans are Immigrants from Pakistan (30.2%, a difference of 0.24%), Bangladeshi (30.1%, a difference of 0.28%), Immigrants from South Central Asia (30.0%, a difference of 0.46%), Immigrants from Afghanistan (30.0%, a difference of 0.48%), and Hispanic or Latino (29.9%, a difference of 0.87%).
DemographicsRating | RankFamily Households with Children
Immigrants | India
100.0
/100
|
#6
Exceptional
31.0%
Immigrants | Central America
100.0
/100
|
#7
Exceptional
31.0%
Yakama
100.0
/100
|
#8
Exceptional
30.8%
Thais
100.0
/100
|
#9
Exceptional
30.6%
Immigrants | Fiji
100.0
/100
|
#10
Exceptional
30.5%
Nepalese
100.0
/100
|
#11
Exceptional
30.5%
Immigrants | Pakistan
100.0
/100
|
#12
Exceptional
30.2%
Afghans
100.0
/100
|
#13
Exceptional
30.2%
Bangladeshis
100.0
/100
|
#14
Exceptional
30.1%
Immigrants | South Central Asia
100.0
/100
|
#15
Exceptional
30.0%
Immigrants | Afghanistan
100.0
/100
|
#16
Exceptional
30.0%
Hispanics or Latinos
100.0
/100
|
#17
Exceptional
29.9%
Salvadorans
100.0
/100
|
#18
Exceptional
29.9%
Alaska Natives
100.0
/100
|
#19
Exceptional
29.9%
Immigrants | El Salvador
100.0
/100
|
#20
Exceptional
29.8%

Demographics Similar to Hmong by Family Households with Children

In terms of family households with children, the demographic groups most similar to Hmong are Immigrants from Nigeria (28.6%, a difference of 0.060%), Immigrants from Ghana (28.6%, a difference of 0.070%), Egyptian (28.6%, a difference of 0.080%), Immigrants from Lebanon (28.6%, a difference of 0.090%), and Filipino (28.6%, a difference of 0.16%).
DemographicsRating | RankFamily Households with Children
Immigrants | Cambodia
100.0
/100
|
#53
Exceptional
28.9%
Sierra Leoneans
100.0
/100
|
#54
Exceptional
28.9%
Immigrants | Asia
100.0
/100
|
#55
Exceptional
28.8%
Immigrants | Guatemala
100.0
/100
|
#56
Exceptional
28.8%
Danes
100.0
/100
|
#57
Exceptional
28.7%
Hawaiians
100.0
/100
|
#58
Exceptional
28.7%
Immigrants | Nigeria
100.0
/100
|
#59
Exceptional
28.6%
Hmong
99.9
/100
|
#60
Exceptional
28.6%
Immigrants | Ghana
99.9
/100
|
#61
Exceptional
28.6%
Egyptians
99.9
/100
|
#62
Exceptional
28.6%
Immigrants | Lebanon
99.9
/100
|
#63
Exceptional
28.6%
Filipinos
99.9
/100
|
#64
Exceptional
28.6%
Hondurans
99.9
/100
|
#65
Exceptional
28.5%
Immigrants | Egypt
99.9
/100
|
#66
Exceptional
28.5%
Ghanaians
99.9
/100
|
#67
Exceptional
28.5%