Zimbabwean vs German Russian Master's Degree
COMPARE
Zimbabwean
German Russian
Master's Degree
Master's Degree Comparison
Zimbabweans
German Russians
17.7%
MASTER'S DEGREE
99.7/ 100
METRIC RATING
73rd/ 347
METRIC RANK
13.5%
MASTER'S DEGREE
4.5/ 100
METRIC RATING
235th/ 347
METRIC RANK
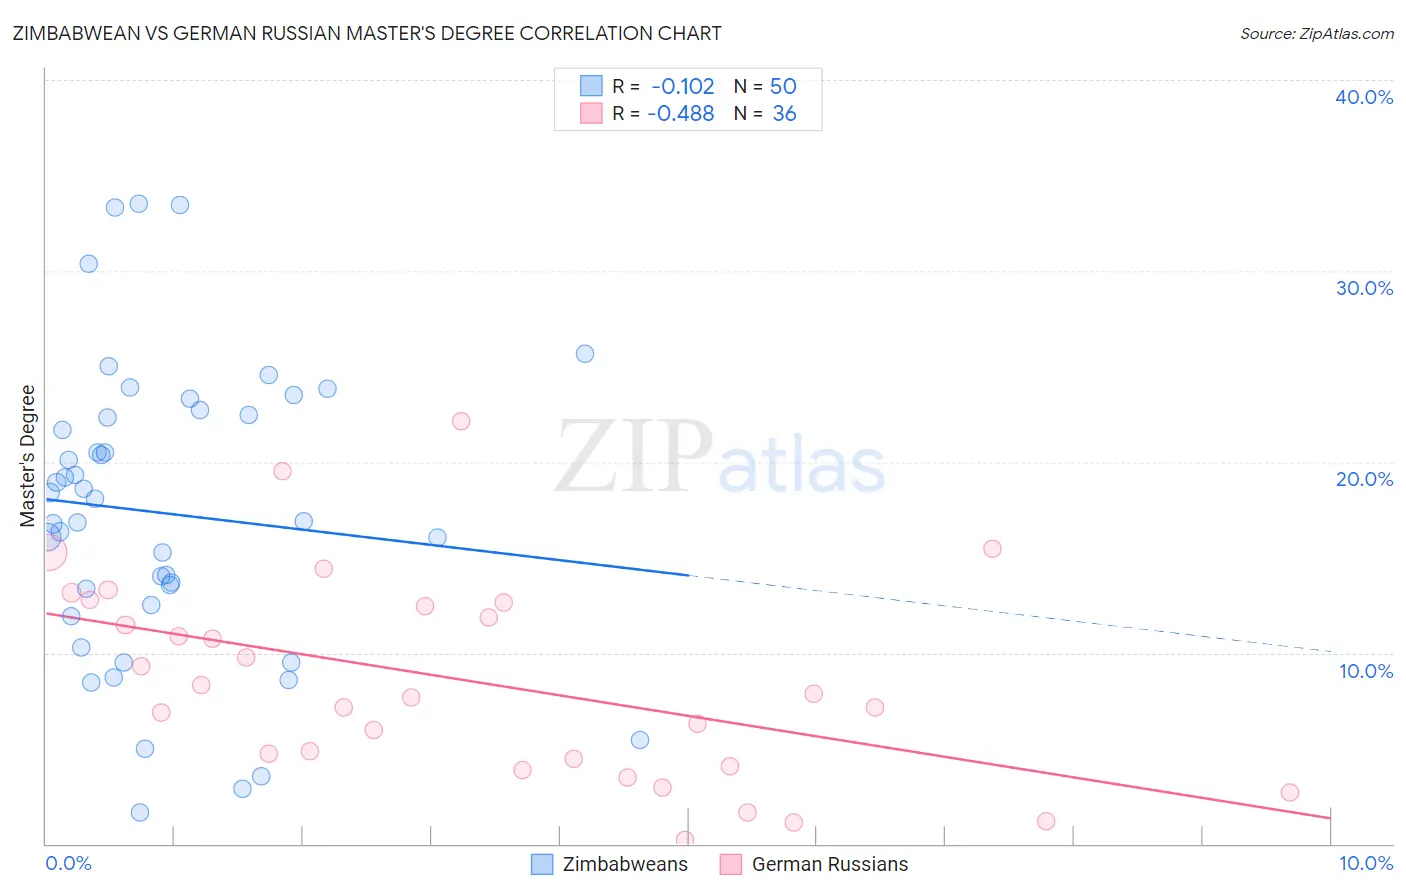
Zimbabwean vs German Russian Master's Degree Correlation Chart
The statistical analysis conducted on geographies consisting of 69,201,212 people shows a poor negative correlation between the proportion of Zimbabweans and percentage of population with at least master's degree education in the United States with a correlation coefficient (R) of -0.102 and weighted average of 17.7%. Similarly, the statistical analysis conducted on geographies consisting of 96,446,864 people shows a moderate negative correlation between the proportion of German Russians and percentage of population with at least master's degree education in the United States with a correlation coefficient (R) of -0.488 and weighted average of 13.5%, a difference of 31.7%.
Master's Degree Correlation Summary
| Measurement | Zimbabwean | German Russian |
| Minimum | 1.7% | 0.22% |
| Maximum | 33.5% | 22.1% |
| Range | 31.8% | 21.9% |
| Mean | 17.3% | 8.5% |
| Median | 17.5% | 7.8% |
| Interquartile 25% (IQ1) | 12.5% | 4.3% |
| Interquartile 75% (IQ3) | 22.4% | 12.5% |
| Interquartile Range (IQR) | 9.9% | 8.3% |
| Standard Deviation (Sample) | 7.7% | 5.3% |
| Standard Deviation (Population) | 7.6% | 5.2% |
Similar Demographics by Master's Degree
Demographics Similar to Zimbabweans by Master's Degree
In terms of master's degree, the demographic groups most similar to Zimbabweans are Lithuanian (17.7%, a difference of 0.11%), Immigrants from Pakistan (17.8%, a difference of 0.28%), Immigrants from Romania (17.7%, a difference of 0.31%), Immigrants from Western Europe (17.8%, a difference of 0.57%), and Egyptian (17.6%, a difference of 0.69%).
| Demographics | Rating | Rank | Master's Degree |
| Ethiopians | 99.8 /100 | #66 | Exceptional 18.0% |
| Immigrants | Argentina | 99.8 /100 | #67 | Exceptional 18.0% |
| Immigrants | Ethiopia | 99.8 /100 | #68 | Exceptional 17.9% |
| Immigrants | Uzbekistan | 99.8 /100 | #69 | Exceptional 17.9% |
| Immigrants | Western Europe | 99.8 /100 | #70 | Exceptional 17.8% |
| Immigrants | Pakistan | 99.7 /100 | #71 | Exceptional 17.8% |
| Lithuanians | 99.7 /100 | #72 | Exceptional 17.7% |
| Zimbabweans | 99.7 /100 | #73 | Exceptional 17.7% |
| Immigrants | Romania | 99.7 /100 | #74 | Exceptional 17.7% |
| Egyptians | 99.6 /100 | #75 | Exceptional 17.6% |
| Immigrants | Indonesia | 99.6 /100 | #76 | Exceptional 17.6% |
| Immigrants | Eastern Europe | 99.6 /100 | #77 | Exceptional 17.6% |
| Immigrants | Hungary | 99.6 /100 | #78 | Exceptional 17.5% |
| Immigrants | Lebanon | 99.6 /100 | #79 | Exceptional 17.5% |
| Carpatho Rusyns | 99.6 /100 | #80 | Exceptional 17.5% |
Demographics Similar to German Russians by Master's Degree
In terms of master's degree, the demographic groups most similar to German Russians are Immigrants from Guyana (13.4%, a difference of 0.11%), Jamaican (13.4%, a difference of 0.34%), Immigrants from Burma/Myanmar (13.5%, a difference of 0.41%), Hmong (13.4%, a difference of 0.48%), and Immigrants from Ecuador (13.6%, a difference of 0.91%).
| Demographics | Rating | Rank | Master's Degree |
| Whites/Caucasians | 9.1 /100 | #228 | Tragic 13.8% |
| British West Indians | 8.8 /100 | #229 | Tragic 13.8% |
| Dutch | 8.7 /100 | #230 | Tragic 13.8% |
| Guyanese | 7.6 /100 | #231 | Tragic 13.7% |
| Immigrants | Philippines | 6.0 /100 | #232 | Tragic 13.6% |
| Immigrants | Ecuador | 5.7 /100 | #233 | Tragic 13.6% |
| Immigrants | Burma/Myanmar | 5.0 /100 | #234 | Tragic 13.5% |
| German Russians | 4.5 /100 | #235 | Tragic 13.5% |
| Immigrants | Guyana | 4.4 /100 | #236 | Tragic 13.4% |
| Jamaicans | 4.1 /100 | #237 | Tragic 13.4% |
| Hmong | 4.0 /100 | #238 | Tragic 13.4% |
| Immigrants | Nonimmigrants | 3.4 /100 | #239 | Tragic 13.3% |
| Guamanians/Chamorros | 2.2 /100 | #240 | Tragic 13.1% |
| U.S. Virgin Islanders | 2.1 /100 | #241 | Tragic 13.1% |
| Spanish Americans | 1.9 /100 | #242 | Tragic 13.0% |