Yup'ik vs Chickasaw Professional Degree
COMPARE
Yup'ik
Chickasaw
Professional Degree
Professional Degree Comparison
Yup'ik
Chickasaw
2.9%
PROFESSIONAL DEGREE
0.0/ 100
METRIC RATING
340th/ 347
METRIC RANK
3.4%
PROFESSIONAL DEGREE
0.1/ 100
METRIC RATING
305th/ 347
METRIC RANK
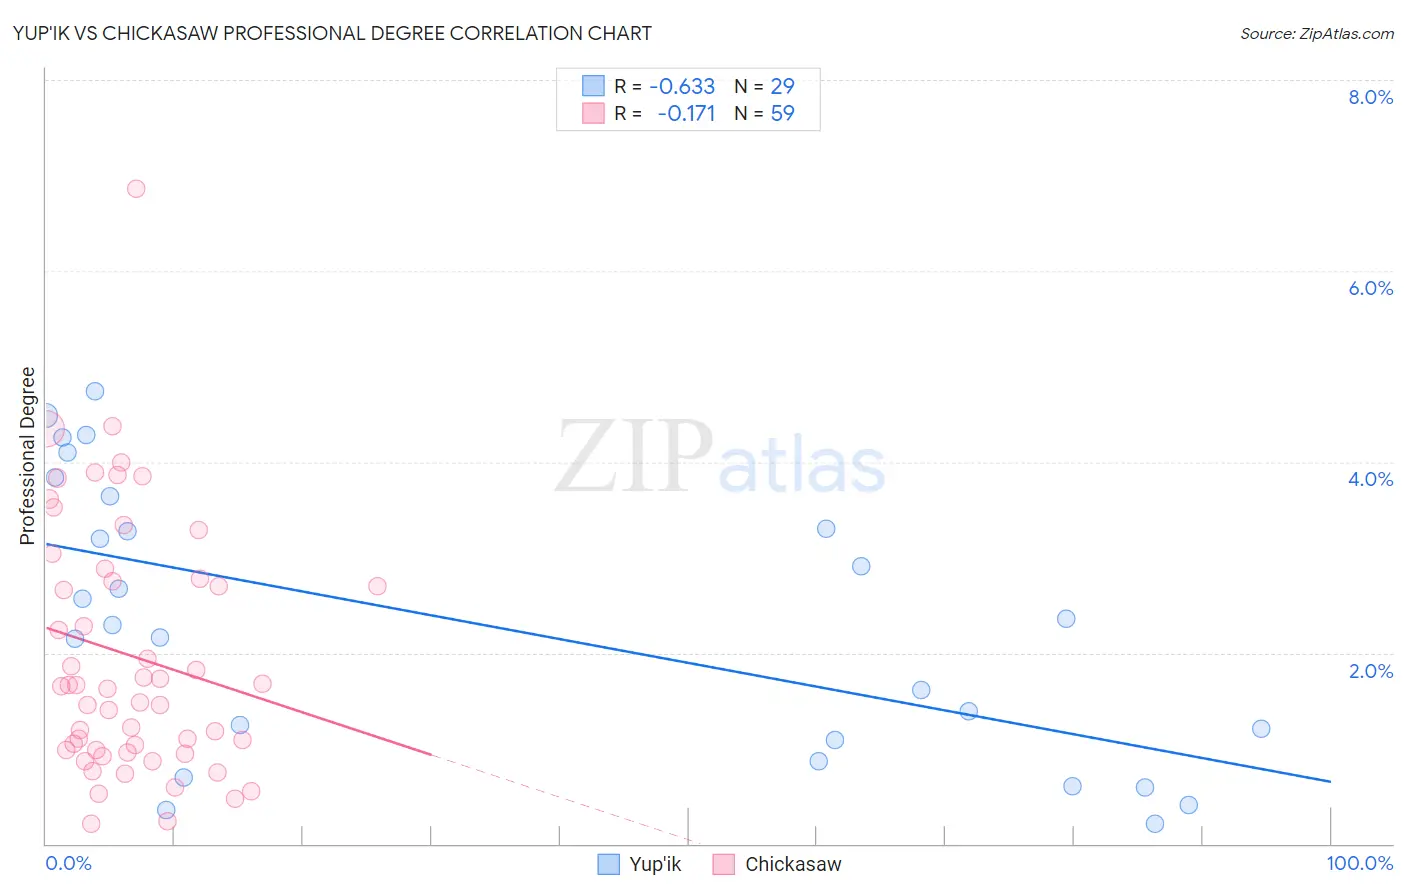
Yup'ik vs Chickasaw Professional Degree Correlation Chart
The statistical analysis conducted on geographies consisting of 39,870,303 people shows a significant negative correlation between the proportion of Yup'ik and percentage of population with at least professional degree education in the United States with a correlation coefficient (R) of -0.633 and weighted average of 2.9%. Similarly, the statistical analysis conducted on geographies consisting of 147,338,770 people shows a poor negative correlation between the proportion of Chickasaw and percentage of population with at least professional degree education in the United States with a correlation coefficient (R) of -0.171 and weighted average of 3.4%, a difference of 17.2%.
Professional Degree Correlation Summary
| Measurement | Yup'ik | Chickasaw |
| Minimum | 0.21% | 0.21% |
| Maximum | 4.7% | 6.9% |
| Range | 4.5% | 6.6% |
| Mean | 2.3% | 2.0% |
| Median | 2.3% | 1.6% |
| Interquartile 25% (IQ1) | 0.98% | 0.98% |
| Interquartile 75% (IQ3) | 3.5% | 2.8% |
| Interquartile Range (IQR) | 2.5% | 1.8% |
| Standard Deviation (Sample) | 1.4% | 1.3% |
| Standard Deviation (Population) | 1.4% | 1.3% |
Similar Demographics by Professional Degree
Demographics Similar to Yup'ik by Professional Degree
In terms of professional degree, the demographic groups most similar to Yup'ik are Immigrants from Central America (2.9%, a difference of 0.050%), Navajo (2.9%, a difference of 0.17%), Arapaho (2.9%, a difference of 0.24%), Tohono O'odham (2.8%, a difference of 0.78%), and Immigrants from the Azores (2.8%, a difference of 1.4%).
| Demographics | Rating | Rank | Professional Degree |
| Puget Sound Salish | 0.0 /100 | #333 | Tragic 3.1% |
| Pennsylvania Germans | 0.0 /100 | #334 | Tragic 3.0% |
| Natives/Alaskans | 0.0 /100 | #335 | Tragic 3.0% |
| Fijians | 0.0 /100 | #336 | Tragic 2.9% |
| Arapaho | 0.0 /100 | #337 | Tragic 2.9% |
| Navajo | 0.0 /100 | #338 | Tragic 2.9% |
| Immigrants | Central America | 0.0 /100 | #339 | Tragic 2.9% |
| Yup'ik | 0.0 /100 | #340 | Tragic 2.9% |
| Tohono O'odham | 0.0 /100 | #341 | Tragic 2.8% |
| Immigrants | Azores | 0.0 /100 | #342 | Tragic 2.8% |
| Mexicans | 0.0 /100 | #343 | Tragic 2.7% |
| Spanish American Indians | 0.0 /100 | #344 | Tragic 2.7% |
| Immigrants | Mexico | 0.0 /100 | #345 | Tragic 2.6% |
| Lumbee | 0.0 /100 | #346 | Tragic 2.5% |
| Houma | 0.0 /100 | #347 | Tragic 2.2% |
Demographics Similar to Chickasaw by Professional Degree
In terms of professional degree, the demographic groups most similar to Chickasaw are Cape Verdean (3.4%, a difference of 0.010%), Cajun (3.4%, a difference of 0.30%), Immigrants from Haiti (3.4%, a difference of 0.31%), Malaysian (3.4%, a difference of 0.97%), and Samoan (3.3%, a difference of 1.1%).
| Demographics | Rating | Rank | Professional Degree |
| Ottawa | 0.2 /100 | #298 | Tragic 3.4% |
| Immigrants | Yemen | 0.2 /100 | #299 | Tragic 3.4% |
| Blacks/African Americans | 0.2 /100 | #300 | Tragic 3.4% |
| Immigrants | Dominican Republic | 0.2 /100 | #301 | Tragic 3.4% |
| Malaysians | 0.2 /100 | #302 | Tragic 3.4% |
| Immigrants | Haiti | 0.2 /100 | #303 | Tragic 3.4% |
| Cajuns | 0.2 /100 | #304 | Tragic 3.4% |
| Chickasaw | 0.1 /100 | #305 | Tragic 3.4% |
| Cape Verdeans | 0.1 /100 | #306 | Tragic 3.4% |
| Samoans | 0.1 /100 | #307 | Tragic 3.3% |
| Shoshone | 0.1 /100 | #308 | Tragic 3.3% |
| Pima | 0.1 /100 | #309 | Tragic 3.3% |
| Immigrants | Latin America | 0.1 /100 | #310 | Tragic 3.3% |
| Cherokee | 0.1 /100 | #311 | Tragic 3.3% |
| Sioux | 0.1 /100 | #312 | Tragic 3.3% |