Yup'ik vs Celtic 10th Grade
COMPARE
Yup'ik
Celtic
10th Grade
10th Grade Comparison
Yup'ik
Celtics
93.6%
10TH GRADE
31.1/ 100
METRIC RATING
191st/ 347
METRIC RANK
95.0%
10TH GRADE
99.8/ 100
METRIC RATING
59th/ 347
METRIC RANK
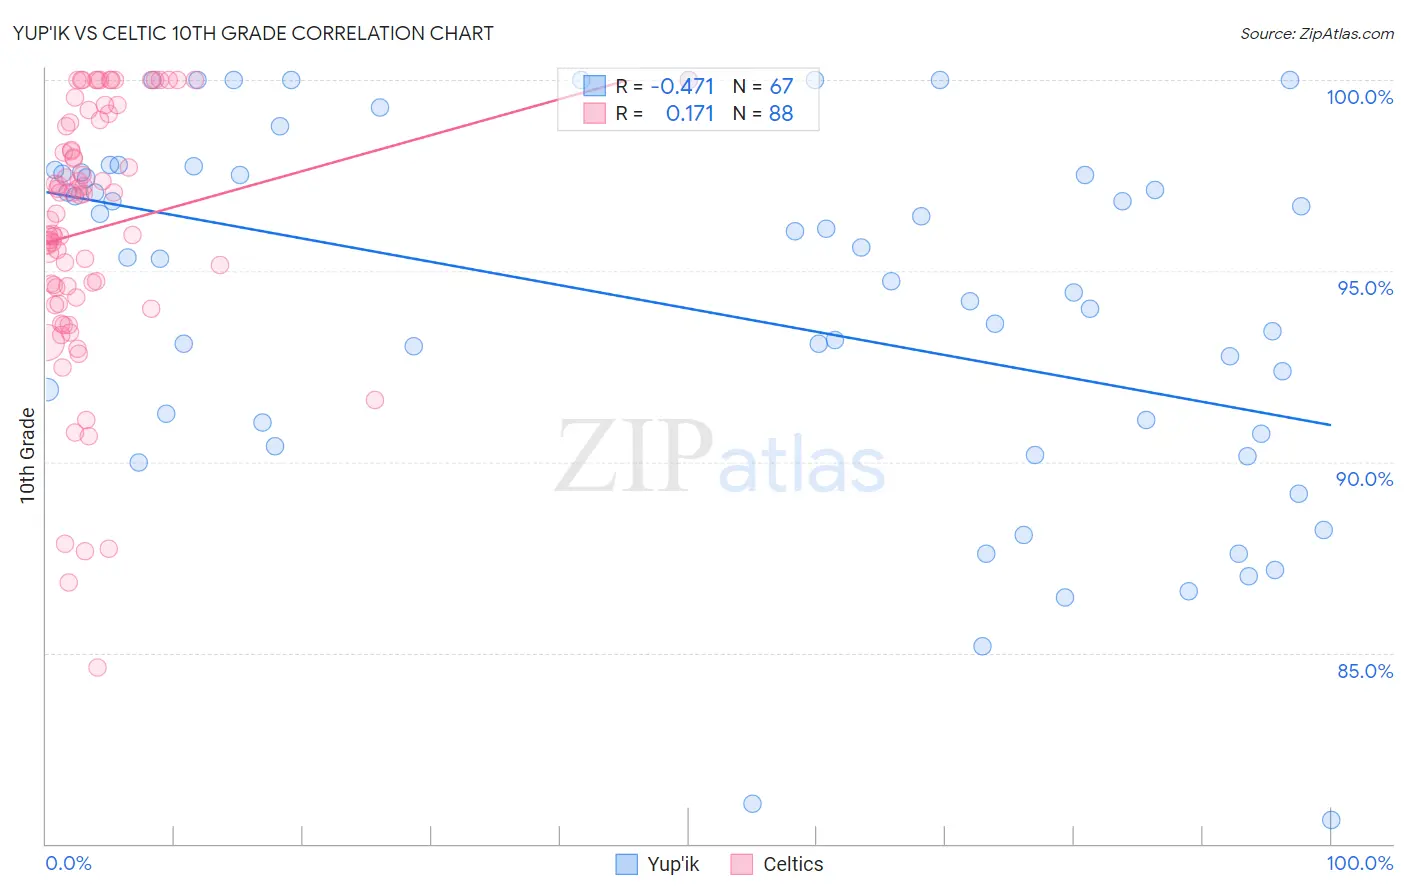
Yup'ik vs Celtic 10th Grade Correlation Chart
The statistical analysis conducted on geographies consisting of 39,963,824 people shows a moderate negative correlation between the proportion of Yup'ik and percentage of population with at least 10th grade education in the United States with a correlation coefficient (R) of -0.471 and weighted average of 93.6%. Similarly, the statistical analysis conducted on geographies consisting of 168,876,981 people shows a poor positive correlation between the proportion of Celtics and percentage of population with at least 10th grade education in the United States with a correlation coefficient (R) of 0.171 and weighted average of 95.0%, a difference of 1.5%.
10th Grade Correlation Summary
| Measurement | Yup'ik | Celtic |
| Minimum | 80.6% | 84.6% |
| Maximum | 100.0% | 100.0% |
| Range | 19.4% | 15.4% |
| Mean | 94.0% | 96.1% |
| Median | 95.3% | 96.8% |
| Interquartile 25% (IQ1) | 90.7% | 94.4% |
| Interquartile 75% (IQ3) | 97.6% | 98.9% |
| Interquartile Range (IQR) | 6.8% | 4.5% |
| Standard Deviation (Sample) | 4.8% | 3.4% |
| Standard Deviation (Population) | 4.7% | 3.4% |
Similar Demographics by 10th Grade
Demographics Similar to Yup'ik by 10th Grade
In terms of 10th grade, the demographic groups most similar to Yup'ik are Laotian (93.6%, a difference of 0.010%), Marshallese (93.6%, a difference of 0.020%), Immigrants from Pakistan (93.6%, a difference of 0.020%), Immigrants from Malaysia (93.5%, a difference of 0.030%), and Panamanian (93.5%, a difference of 0.030%).
| Demographics | Rating | Rank | 10th Grade |
| Choctaw | 36.6 /100 | #184 | Fair 93.6% |
| Sudanese | 36.6 /100 | #185 | Fair 93.6% |
| Immigrants | Eastern Asia | 35.1 /100 | #186 | Fair 93.6% |
| Liberians | 34.7 /100 | #187 | Fair 93.6% |
| Marshallese | 33.2 /100 | #188 | Fair 93.6% |
| Immigrants | Pakistan | 32.5 /100 | #189 | Fair 93.6% |
| Laotians | 32.1 /100 | #190 | Fair 93.6% |
| Yup'ik | 31.1 /100 | #191 | Fair 93.6% |
| Immigrants | Malaysia | 28.0 /100 | #192 | Fair 93.5% |
| Panamanians | 28.0 /100 | #193 | Fair 93.5% |
| Immigrants | Morocco | 26.9 /100 | #194 | Fair 93.5% |
| Cheyenne | 26.8 /100 | #195 | Fair 93.5% |
| Moroccans | 25.3 /100 | #196 | Fair 93.5% |
| Pueblo | 23.9 /100 | #197 | Fair 93.5% |
| Immigrants | Micronesia | 23.2 /100 | #198 | Fair 93.5% |
Demographics Similar to Celtics by 10th Grade
In terms of 10th grade, the demographic groups most similar to Celtics are Aleut (95.0%, a difference of 0.0%), Immigrants from Ireland (95.0%, a difference of 0.010%), New Zealander (95.0%, a difference of 0.010%), Ukrainian (95.0%, a difference of 0.010%), and Cypriot (95.0%, a difference of 0.010%).
| Demographics | Rating | Rank | 10th Grade |
| Ottawa | 99.8 /100 | #52 | Exceptional 95.1% |
| Immigrants | North America | 99.8 /100 | #53 | Exceptional 95.0% |
| Immigrants | Lithuania | 99.8 /100 | #54 | Exceptional 95.0% |
| Immigrants | Ireland | 99.8 /100 | #55 | Exceptional 95.0% |
| New Zealanders | 99.8 /100 | #56 | Exceptional 95.0% |
| Ukrainians | 99.8 /100 | #57 | Exceptional 95.0% |
| Aleuts | 99.8 /100 | #58 | Exceptional 95.0% |
| Celtics | 99.8 /100 | #59 | Exceptional 95.0% |
| Cypriots | 99.8 /100 | #60 | Exceptional 95.0% |
| Chippewa | 99.8 /100 | #61 | Exceptional 95.0% |
| Thais | 99.8 /100 | #62 | Exceptional 95.0% |
| Immigrants | Singapore | 99.8 /100 | #63 | Exceptional 95.0% |
| Native Hawaiians | 99.7 /100 | #64 | Exceptional 95.0% |
| Turks | 99.7 /100 | #65 | Exceptional 95.0% |
| Immigrants | Australia | 99.7 /100 | #66 | Exceptional 94.9% |