Yuman vs Israeli 12th Grade, No Diploma
COMPARE
Yuman
Israeli
12th Grade, No Diploma
12th Grade, No Diploma Comparison
Yuman
Israelis
86.5%
12TH GRADE, NO DIPLOMA
0.0/ 100
METRIC RATING
323rd/ 347
METRIC RANK
92.1%
12TH GRADE, NO DIPLOMA
96.8/ 100
METRIC RATING
112th/ 347
METRIC RANK
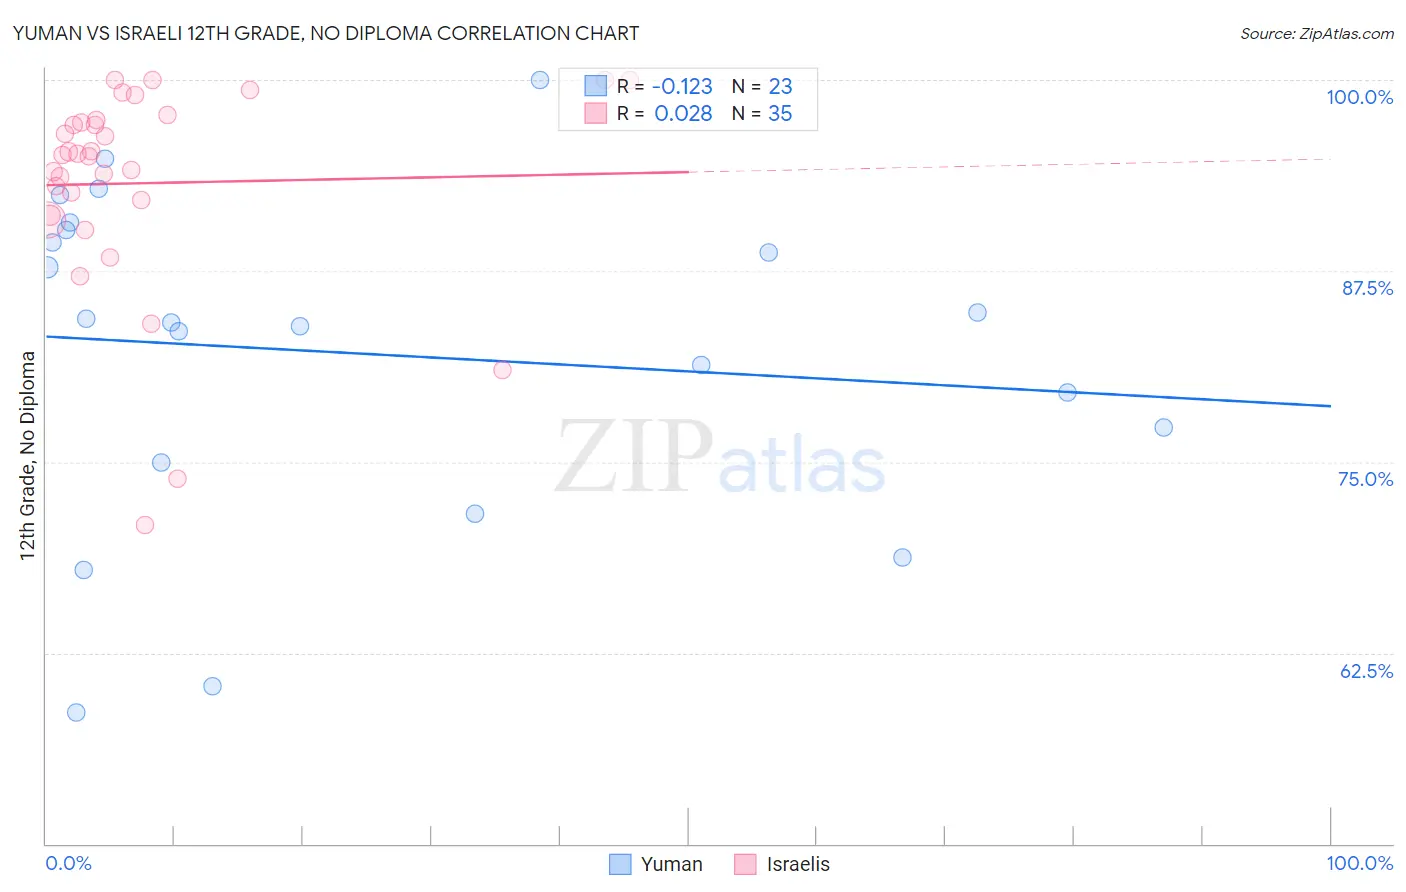
Yuman vs Israeli 12th Grade, No Diploma Correlation Chart
The statistical analysis conducted on geographies consisting of 40,696,349 people shows a poor negative correlation between the proportion of Yuman and percentage of population with at least 12th grade (no diploma) education in the United States with a correlation coefficient (R) of -0.123 and weighted average of 86.5%. Similarly, the statistical analysis conducted on geographies consisting of 211,220,151 people shows no correlation between the proportion of Israelis and percentage of population with at least 12th grade (no diploma) education in the United States with a correlation coefficient (R) of 0.028 and weighted average of 92.1%, a difference of 6.5%.
12th Grade, No Diploma Correlation Summary
| Measurement | Yuman | Israeli |
| Minimum | 58.6% | 70.8% |
| Maximum | 100.0% | 100.0% |
| Range | 41.4% | 29.2% |
| Mean | 82.1% | 93.2% |
| Median | 84.1% | 95.1% |
| Interquartile 25% (IQ1) | 74.9% | 91.2% |
| Interquartile 75% (IQ3) | 90.2% | 97.4% |
| Interquartile Range (IQR) | 15.3% | 6.2% |
| Standard Deviation (Sample) | 10.9% | 6.9% |
| Standard Deviation (Population) | 10.6% | 6.8% |
Similar Demographics by 12th Grade, No Diploma
Demographics Similar to Yuman by 12th Grade, No Diploma
In terms of 12th grade, no diploma, the demographic groups most similar to Yuman are Central American Indian (86.5%, a difference of 0.0%), Puerto Rican (86.5%, a difference of 0.080%), Immigrants from Nicaragua (86.6%, a difference of 0.11%), Immigrants from Belize (87.0%, a difference of 0.57%), and Belizean (87.0%, a difference of 0.65%).
| Demographics | Rating | Rank | 12th Grade, No Diploma |
| Apache | 0.0 /100 | #316 | Tragic 87.3% |
| Navajo | 0.0 /100 | #317 | Tragic 87.1% |
| Belizeans | 0.0 /100 | #318 | Tragic 87.0% |
| Immigrants | Belize | 0.0 /100 | #319 | Tragic 87.0% |
| Immigrants | Nicaragua | 0.0 /100 | #320 | Tragic 86.6% |
| Puerto Ricans | 0.0 /100 | #321 | Tragic 86.5% |
| Central American Indians | 0.0 /100 | #322 | Tragic 86.5% |
| Yuman | 0.0 /100 | #323 | Tragic 86.5% |
| Immigrants | Cabo Verde | 0.0 /100 | #324 | Tragic 85.8% |
| Mexican American Indians | 0.0 /100 | #325 | Tragic 85.7% |
| Dominicans | 0.0 /100 | #326 | Tragic 85.7% |
| Lumbee | 0.0 /100 | #327 | Tragic 85.7% |
| Hondurans | 0.0 /100 | #328 | Tragic 85.5% |
| Hispanics or Latinos | 0.0 /100 | #329 | Tragic 85.4% |
| Immigrants | Azores | 0.0 /100 | #330 | Tragic 85.3% |
Demographics Similar to Israelis by 12th Grade, No Diploma
In terms of 12th grade, no diploma, the demographic groups most similar to Israelis are Immigrants from Hungary (92.1%, a difference of 0.020%), Palestinian (92.1%, a difference of 0.020%), Immigrants from Greece (92.1%, a difference of 0.020%), Immigrants from Zimbabwe (92.1%, a difference of 0.030%), and Yugoslavian (92.1%, a difference of 0.030%).
| Demographics | Rating | Rank | 12th Grade, No Diploma |
| Immigrants | Belarus | 97.4 /100 | #105 | Exceptional 92.2% |
| Immigrants | Russia | 97.3 /100 | #106 | Exceptional 92.2% |
| Syrians | 97.2 /100 | #107 | Exceptional 92.2% |
| Jordanians | 97.2 /100 | #108 | Exceptional 92.2% |
| Immigrants | Hungary | 97.0 /100 | #109 | Exceptional 92.1% |
| Palestinians | 97.0 /100 | #110 | Exceptional 92.1% |
| Immigrants | Greece | 96.9 /100 | #111 | Exceptional 92.1% |
| Israelis | 96.8 /100 | #112 | Exceptional 92.1% |
| Immigrants | Zimbabwe | 96.5 /100 | #113 | Exceptional 92.1% |
| Yugoslavians | 96.5 /100 | #114 | Exceptional 92.1% |
| Immigrants | Sri Lanka | 96.4 /100 | #115 | Exceptional 92.1% |
| Aleuts | 96.3 /100 | #116 | Exceptional 92.1% |
| Immigrants | Eastern Europe | 96.3 /100 | #117 | Exceptional 92.1% |
| Puget Sound Salish | 95.8 /100 | #118 | Exceptional 92.0% |
| Immigrants | Germany | 95.5 /100 | #119 | Exceptional 92.0% |