Yugoslavian vs Immigrants from Cambodia 10th Grade

COMPARE

Yugoslavian
Race
Ancestry
AfghanAfricanAlaska NativeAlaskan AthabascanAlbanianAleutAlsatianAmericanApacheArabArapahoArgentineanArmenianAssyrian/Chaldean/SyriacAustralianAustrianBahamianBangladeshiBarbadianBasqueBelgianBelizeanBermudanBhutaneseBlackfeetBolivianBrazilianBritishBritish West IndianBulgarianBurmeseCajunCambodianCanadianCape VerdeanCarpatho RusynCelticCentral AmericanCentral American IndianCherokeeCheyenneChickasawChileanChineseChippewaChoctawColombianColvilleComancheCosta RicanCreeCreekCroatianCrowCubanCypriotCzechCzechoslovakianDanishDelawareDominicanDutchDutch West IndianEastern EuropeanEcuadorianEgyptianEnglishEstonianEthiopianEuropeanFijianFilipinoFinnishFrenchFrench American IndianFrench CanadianGermanGerman RussianGhanaianGreekGuamanian/ChamorroGuatemalanGuyaneseHaitianHmongHonduranHopiHoumaHungarianIcelanderIndian (Asian)IndonesianInupiatIranianIraqiIrishIroquoisIsraeliItalianJamaicanJapaneseJordanianKenyanKiowaKoreanLaotianLatvianLebaneseLiberianLithuanianLumbeeLuxembourgerMacedonianMalaysianMalteseMarshalleseMenomineeMexicanMexican American IndianMongolianMoroccanNative HawaiianNavajoNepaleseNew ZealanderNicaraguanNigerianNorthern EuropeanNorwegianOkinawanOsageOttawaPaiutePakistaniPalestinianPanamanianParaguayanPennsylvania GermanPeruvianPimaPolishPortuguesePotawatomiPuebloPuerto RicanPuget Sound SalishRomanianRussianSalvadoranSamoanScandinavianScotch-IrishScottishSeminoleSenegaleseSerbianShoshoneSierra LeoneanSiouxSlavicSlovakSloveneSomaliSouth AfricanSouth AmericanSouth American IndianSoviet UnionSpaniardSpanishSpanish AmericanSpanish American IndianSri LankanSubsaharan AfricanSudaneseSwedishSwissSyrianTaiwaneseThaiTlingit-HaidaTohono O'OdhamTonganTrinidadian and TobagonianTsimshianTurkishU.S. Virgin IslanderUgandanUkrainianUruguayanUteVenezuelanVietnameseWelshWest IndianYakamaYaquiYugoslavianYumanYup'ikZimbabwean
Immigration
NonimmigrantsImmigrantsAfghanistanAfricaAlbaniaArgentinaArmeniaAsiaAustraliaAustriaBahamasBangladeshBarbadosBelarusBelgiumBelizeBoliviaBosnia and HerzegovinaBrazilBulgariaBurma/MyanmarCabo VerdeCameroonCanadaCaribbeanCentral AmericaChileChinaColombiaCongoCosta RicaCroatiaCubaCzechoslovakiaDenmarkDominicaDominican RepublicEastern AfricaEastern AsiaEastern EuropeEcuadorEgyptEl SalvadorEnglandEritreaEthiopiaEuropeFijiFranceGermanyGhanaGreeceGrenadaGuatemalaGuyanaHaitiHondurasHong KongHungaryIndiaIndonesiaIranIraqIrelandIsraelItalyJamaicaJapanJordanKazakhstanKenyaKoreaKuwaitLaosLatin AmericaLatviaLebanonLiberiaLithuaniaMalaysiaMexicoMicronesiaMiddle AfricaMoldovaMoroccoNepalNetherlandsNicaraguaNigeriaNorth AmericaNorth MacedoniaNorthern AfricaNorthern EuropeNorwayOceaniaPakistanPanamaPeruPhilippinesPolandPortugalRomaniaRussiaSaudi ArabiaScotlandSenegalSerbiaSierra LeoneSingaporeSomaliaSouth AfricaSouth AmericaSouth Central AsiaSouth Eastern AsiaSouthern EuropeSpainSri LankaSt. Vincent and the GrenadinesSudanSwedenSwitzerlandSyriaTaiwanThailandTrinidad and TobagoTurkeyUgandaUkraineUruguayUzbekistanVenezuelaVietnamWest IndiesWestern AfricaWestern AsiaWestern EuropeYemenZaireZimbabweAzores
Immigrants from Cambodia
Race
Ancestry
AfghanAfricanAlaska NativeAlaskan AthabascanAlbanianAleutAlsatianAmericanApacheArabArapahoArgentineanArmenianAssyrian/Chaldean/SyriacAustralianAustrianBahamianBangladeshiBarbadianBasqueBelgianBelizeanBermudanBhutaneseBlackfeetBolivianBrazilianBritishBritish West IndianBulgarianBurmeseCajunCambodianCanadianCape VerdeanCarpatho RusynCelticCentral AmericanCentral American IndianCherokeeCheyenneChickasawChileanChineseChippewaChoctawColombianColvilleComancheCosta RicanCreeCreekCroatianCrowCubanCypriotCzechCzechoslovakianDanishDelawareDominicanDutchDutch West IndianEastern EuropeanEcuadorianEgyptianEnglishEstonianEthiopianEuropeanFijianFilipinoFinnishFrenchFrench American IndianFrench CanadianGermanGerman RussianGhanaianGreekGuamanian/ChamorroGuatemalanGuyaneseHaitianHmongHonduranHopiHoumaHungarianIcelanderIndian (Asian)IndonesianInupiatIranianIraqiIrishIroquoisIsraeliItalianJamaicanJapaneseJordanianKenyanKiowaKoreanLaotianLatvianLebaneseLiberianLithuanianLumbeeLuxembourgerMacedonianMalaysianMalteseMarshalleseMenomineeMexicanMexican American IndianMongolianMoroccanNative HawaiianNavajoNepaleseNew ZealanderNicaraguanNigerianNorthern EuropeanNorwegianOkinawanOsageOttawaPaiutePakistaniPalestinianPanamanianParaguayanPennsylvania GermanPeruvianPimaPolishPortuguesePotawatomiPuebloPuerto RicanPuget Sound SalishRomanianRussianSalvadoranSamoanScandinavianScotch-IrishScottishSeminoleSenegaleseSerbianShoshoneSierra LeoneanSiouxSlavicSlovakSloveneSomaliSouth AfricanSouth AmericanSouth American IndianSoviet UnionSpaniardSpanishSpanish AmericanSpanish American IndianSri LankanSubsaharan AfricanSudaneseSwedishSwissSyrianTaiwaneseThaiTlingit-HaidaTohono O'OdhamTonganTrinidadian and TobagonianTsimshianTurkishU.S. Virgin IslanderUgandanUkrainianUruguayanUteVenezuelanVietnameseWelshWest IndianYakamaYaquiYumanYup'ikZimbabwean
Immigration
NonimmigrantsImmigrantsAfghanistanAfricaAlbaniaArgentinaArmeniaAsiaAustraliaAustriaBahamasBangladeshBarbadosBelarusBelgiumBelizeBoliviaBosnia and HerzegovinaBrazilBulgariaBurma/MyanmarCabo VerdeCambodiaCameroonCanadaCaribbeanCentral AmericaChileChinaColombiaCongoCosta RicaCroatiaCubaCzechoslovakiaDenmarkDominicaDominican RepublicEastern AfricaEastern AsiaEastern EuropeEcuadorEgyptEl SalvadorEnglandEritreaEthiopiaEuropeFijiFranceGermanyGhanaGreeceGrenadaGuatemalaGuyanaHaitiHondurasHong KongHungaryIndiaIndonesiaIranIraqIrelandIsraelItalyJamaicaJapanJordanKazakhstanKenyaKoreaKuwaitLaosLatin AmericaLatviaLebanonLiberiaLithuaniaMalaysiaMexicoMicronesiaMiddle AfricaMoldovaMoroccoNepalNetherlandsNicaraguaNigeriaNorth AmericaNorth MacedoniaNorthern AfricaNorthern EuropeNorwayOceaniaPakistanPanamaPeruPhilippinesPolandPortugalRomaniaRussiaSaudi ArabiaScotlandSenegalSerbiaSierra LeoneSingaporeSomaliaSouth AfricaSouth AmericaSouth Central AsiaSouth Eastern AsiaSouthern EuropeSpainSri LankaSt. Vincent and the GrenadinesSudanSwedenSwitzerlandSyriaTaiwanThailandTrinidad and TobagoTurkeyUgandaUkraineUruguayUzbekistanVenezuelaVietnamWest IndiesWestern AfricaWestern AsiaWestern EuropeYemenZaireZimbabweAzores
10th Grade
Income
Poverty
Unemployment
Labor Participation
Family Structure
Vehicle Availability
Education Level
Disability

10th Grade Comparison

Yugoslavians

Immigrants from Cambodia

Exceptional
Tragic
94.6%
10TH GRADE
98.4/ 100
METRIC RATING
92nd/ 347
METRIC RANK
90.9%
10TH GRADE
0.0/ 100
METRIC RATING
311th/ 347
METRIC RANK

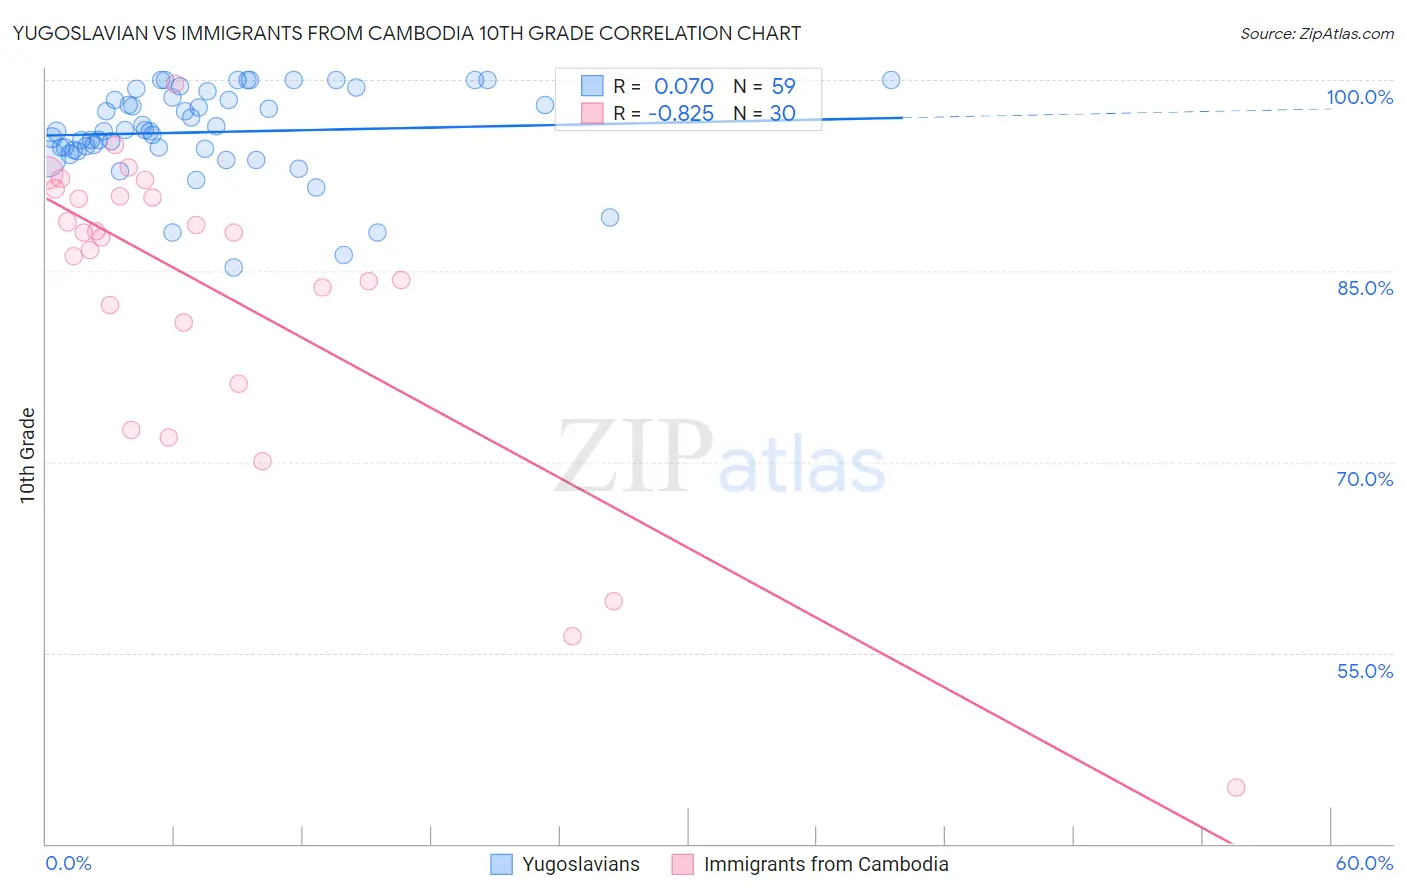
Yugoslavian vs Immigrants from Cambodia 10th Grade Correlation Chart

The statistical analysis conducted on geographies consisting of 285,719,638 people shows a slight positive correlation between the proportion of Yugoslavians and percentage of population with at least 10th grade education in the United States with a correlation coefficient (R) of 0.070 and weighted average of 94.6%. Similarly, the statistical analysis conducted on geographies consisting of 205,153,442 people shows a very strong negative correlation between the proportion of Immigrants from Cambodia and percentage of population with at least 10th grade education in the United States with a correlation coefficient (R) of -0.825 and weighted average of 90.9%, a difference of 4.0%.
Yugoslavian vs Immigrants from Cambodia 10th Grade

10th Grade Correlation Summary

MeasurementYugoslavianImmigrants from Cambodia
Minimum85.3%44.4%
Maximum100.0%99.7%
Range14.7%55.2%
Mean95.9%83.2%
Median95.9%87.8%
Interquartile 25% (IQ1)94.5%80.9%
Interquartile 75% (IQ3)98.7%90.8%
Interquartile Range (IQR)4.1%9.9%
Standard Deviation (Sample)3.5%12.4%
Standard Deviation (Population)3.5%12.2%

Similar Demographics by 10th Grade

Demographics Similar to Yugoslavians by 10th Grade

In terms of 10th grade, the demographic groups most similar to Yugoslavians are Soviet Union (94.6%, a difference of 0.010%), Immigrants from Germany (94.6%, a difference of 0.010%), Menominee (94.6%, a difference of 0.010%), Immigrants from Switzerland (94.6%, a difference of 0.020%), and Lebanese (94.6%, a difference of 0.020%).
DemographicsRating | Rank10th Grade
Crow
99.0
/100
|
#85
Exceptional
94.7%
Puget Sound Salish
99.0
/100
|
#86
Exceptional
94.7%
Immigrants | Saudi Arabia
99.0
/100
|
#87
Exceptional
94.7%
Immigrants | Japan
99.0
/100
|
#88
Exceptional
94.7%
Immigrants | Moldova
98.9
/100
|
#89
Exceptional
94.7%
South Africans
98.8
/100
|
#90
Exceptional
94.7%
Whites/Caucasians
98.8
/100
|
#91
Exceptional
94.7%
Yugoslavians
98.4
/100
|
#92
Exceptional
94.6%
Soviet Union
98.3
/100
|
#93
Exceptional
94.6%
Immigrants | Germany
98.3
/100
|
#94
Exceptional
94.6%
Menominee
98.3
/100
|
#95
Exceptional
94.6%
Immigrants | Switzerland
98.3
/100
|
#96
Exceptional
94.6%
Lebanese
98.3
/100
|
#97
Exceptional
94.6%
Immigrants | Bulgaria
98.1
/100
|
#98
Exceptional
94.6%
Immigrants | France
97.9
/100
|
#99
Exceptional
94.5%

Demographics Similar to Immigrants from Cambodia by 10th Grade

In terms of 10th grade, the demographic groups most similar to Immigrants from Cambodia are Vietnamese (90.9%, a difference of 0.020%), Immigrants (91.0%, a difference of 0.060%), Immigrants from Bangladesh (91.0%, a difference of 0.10%), Immigrants from Fiji (91.0%, a difference of 0.11%), and Immigrants from Portugal (90.8%, a difference of 0.16%).
DemographicsRating | Rank10th Grade
Pima
0.0
/100
|
#304
Tragic
91.2%
Immigrants | Dominica
0.0
/100
|
#305
Tragic
91.1%
Yaqui
0.0
/100
|
#306
Tragic
91.1%
Immigrants | Fiji
0.0
/100
|
#307
Tragic
91.0%
Immigrants | Bangladesh
0.0
/100
|
#308
Tragic
91.0%
Immigrants | Immigrants
0.0
/100
|
#309
Tragic
91.0%
Vietnamese
0.0
/100
|
#310
Tragic
90.9%
Immigrants | Cambodia
0.0
/100
|
#311
Tragic
90.9%
Immigrants | Portugal
0.0
/100
|
#312
Tragic
90.8%
Cape Verdeans
0.0
/100
|
#313
Tragic
90.8%
Nepalese
0.0
/100
|
#314
Tragic
90.7%
Immigrants | Caribbean
0.0
/100
|
#315
Tragic
90.6%
Ecuadorians
0.0
/100
|
#316
Tragic
90.6%
Immigrants | Ecuador
0.0
/100
|
#317
Tragic
90.4%
Immigrants | Cuba
0.0
/100
|
#318
Tragic
90.2%