White/Caucasian vs Serbian Doctorate Degree

COMPARE

White/Caucasian
Race
Ancestry
AfghanAfricanAlaska NativeAlaskan AthabascanAlbanianAleutAlsatianAmericanApacheArabArapahoArgentineanArmenianAssyrian/Chaldean/SyriacAustralianAustrianBahamianBangladeshiBarbadianBasqueBelgianBelizeanBermudanBhutaneseBlackfeetBolivianBrazilianBritishBritish West IndianBulgarianBurmeseCajunCambodianCanadianCape VerdeanCarpatho RusynCelticCentral AmericanCentral American IndianCherokeeCheyenneChickasawChileanChineseChippewaChoctawColombianColvilleComancheCosta RicanCreeCreekCroatianCrowCubanCypriotCzechCzechoslovakianDanishDelawareDominicanDutchDutch West IndianEastern EuropeanEcuadorianEgyptianEnglishEstonianEthiopianEuropeanFijianFilipinoFinnishFrenchFrench American IndianFrench CanadianGermanGerman RussianGhanaianGreekGuamanian/ChamorroGuatemalanGuyaneseHaitianHmongHonduranHopiHoumaHungarianIcelanderIndian (Asian)IndonesianInupiatIranianIraqiIrishIroquoisIsraeliItalianJamaicanJapaneseJordanianKenyanKiowaKoreanLaotianLatvianLebaneseLiberianLithuanianLumbeeLuxembourgerMacedonianMalaysianMalteseMarshalleseMenomineeMexicanMexican American IndianMongolianMoroccanNative HawaiianNavajoNepaleseNew ZealanderNicaraguanNigerianNorthern EuropeanNorwegianOkinawanOsageOttawaPaiutePakistaniPalestinianPanamanianParaguayanPennsylvania GermanPeruvianPimaPolishPortuguesePotawatomiPuebloPuerto RicanPuget Sound SalishRomanianRussianSalvadoranSamoanScandinavianScotch-IrishScottishSeminoleSenegaleseShoshoneSierra LeoneanSiouxSlavicSlovakSloveneSomaliSouth AfricanSouth AmericanSouth American IndianSoviet UnionSpaniardSpanishSpanish AmericanSpanish American IndianSri LankanSubsaharan AfricanSudaneseSwedishSwissSyrianTaiwaneseThaiTlingit-HaidaTohono O'OdhamTonganTrinidadian and TobagonianTsimshianTurkishU.S. Virgin IslanderUgandanUkrainianUruguayanUteVenezuelanVietnameseWelshWest IndianYakamaYaquiYugoslavianYumanYup'ikZimbabwean
Immigration
NonimmigrantsImmigrantsAfghanistanAfricaAlbaniaArgentinaArmeniaAsiaAustraliaAustriaBahamasBangladeshBarbadosBelarusBelgiumBelizeBoliviaBosnia and HerzegovinaBrazilBulgariaBurma/MyanmarCabo VerdeCambodiaCameroonCanadaCaribbeanCentral AmericaChileChinaColombiaCongoCosta RicaCroatiaCubaCzechoslovakiaDenmarkDominicaDominican RepublicEastern AfricaEastern AsiaEastern EuropeEcuadorEgyptEl SalvadorEnglandEritreaEthiopiaEuropeFijiFranceGermanyGhanaGreeceGrenadaGuatemalaGuyanaHaitiHondurasHong KongHungaryIndiaIndonesiaIranIraqIrelandIsraelItalyJamaicaJapanJordanKazakhstanKenyaKoreaKuwaitLaosLatin AmericaLatviaLebanonLiberiaLithuaniaMalaysiaMexicoMicronesiaMiddle AfricaMoldovaMoroccoNepalNetherlandsNicaraguaNigeriaNorth AmericaNorth MacedoniaNorthern AfricaNorthern EuropeNorwayOceaniaPakistanPanamaPeruPhilippinesPolandPortugalRomaniaRussiaSaudi ArabiaScotlandSenegalSerbiaSierra LeoneSingaporeSomaliaSouth AfricaSouth AmericaSouth Central AsiaSouth Eastern AsiaSouthern EuropeSpainSri LankaSt. Vincent and the GrenadinesSudanSwedenSwitzerlandSyriaTaiwanThailandTrinidad and TobagoTurkeyUgandaUkraineUruguayUzbekistanVenezuelaVietnamWest IndiesWestern AfricaWestern AsiaWestern EuropeYemenZaireZimbabweAzores
Serbian
Race
Ancestry
AfghanAfricanAlaska NativeAlaskan AthabascanAlbanianAleutAlsatianAmericanApacheArabArapahoArgentineanArmenianAssyrian/Chaldean/SyriacAustralianAustrianBahamianBangladeshiBarbadianBasqueBelgianBelizeanBermudanBhutaneseBlackfeetBolivianBrazilianBritishBritish West IndianBulgarianBurmeseCajunCambodianCanadianCape VerdeanCarpatho RusynCelticCentral AmericanCentral American IndianCherokeeCheyenneChickasawChileanChineseChippewaChoctawColombianColvilleComancheCosta RicanCreeCreekCroatianCrowCubanCypriotCzechCzechoslovakianDanishDelawareDominicanDutchDutch West IndianEastern EuropeanEcuadorianEgyptianEnglishEstonianEthiopianEuropeanFijianFilipinoFinnishFrenchFrench American IndianFrench CanadianGermanGerman RussianGhanaianGreekGuamanian/ChamorroGuatemalanGuyaneseHaitianHmongHonduranHopiHoumaHungarianIcelanderIndian (Asian)IndonesianInupiatIranianIraqiIrishIroquoisIsraeliItalianJamaicanJapaneseJordanianKenyanKiowaKoreanLaotianLatvianLebaneseLiberianLithuanianLumbeeLuxembourgerMacedonianMalaysianMalteseMarshalleseMenomineeMexicanMexican American IndianMongolianMoroccanNative HawaiianNavajoNepaleseNew ZealanderNicaraguanNigerianNorthern EuropeanNorwegianOkinawanOsageOttawaPaiutePakistaniPalestinianPanamanianParaguayanPennsylvania GermanPeruvianPimaPolishPortuguesePotawatomiPuebloPuerto RicanPuget Sound SalishRomanianRussianSalvadoranSamoanScandinavianScotch-IrishScottishSeminoleSenegaleseSerbianShoshoneSierra LeoneanSiouxSlavicSlovakSloveneSomaliSouth AfricanSouth AmericanSouth American IndianSoviet UnionSpaniardSpanishSpanish AmericanSpanish American IndianSri LankanSubsaharan AfricanSudaneseSwedishSwissSyrianTaiwaneseThaiTlingit-HaidaTohono O'OdhamTonganTrinidadian and TobagonianTsimshianTurkishU.S. Virgin IslanderUgandanUkrainianUruguayanUteVenezuelanVietnameseWelshWest IndianYakamaYaquiYugoslavianYumanYup'ikZimbabwean
Immigration
NonimmigrantsImmigrantsAfghanistanAfricaAlbaniaArgentinaArmeniaAsiaAustraliaAustriaBahamasBangladeshBarbadosBelarusBelgiumBelizeBoliviaBosnia and HerzegovinaBrazilBulgariaBurma/MyanmarCabo VerdeCambodiaCameroonCanadaCaribbeanCentral AmericaChileChinaColombiaCongoCosta RicaCroatiaCubaCzechoslovakiaDenmarkDominicaDominican RepublicEastern AfricaEastern AsiaEastern EuropeEcuadorEgyptEl SalvadorEnglandEritreaEthiopiaEuropeFijiFranceGermanyGhanaGreeceGrenadaGuatemalaGuyanaHaitiHondurasHong KongHungaryIndiaIndonesiaIranIraqIrelandIsraelItalyJamaicaJapanJordanKazakhstanKenyaKoreaKuwaitLaosLatin AmericaLatviaLebanonLiberiaLithuaniaMalaysiaMexicoMicronesiaMiddle AfricaMoldovaMoroccoNepalNetherlandsNicaraguaNigeriaNorth AmericaNorth MacedoniaNorthern AfricaNorthern EuropeNorwayOceaniaPakistanPanamaPeruPhilippinesPolandPortugalRomaniaRussiaSaudi ArabiaScotlandSenegalSerbiaSierra LeoneSingaporeSomaliaSouth AfricaSouth AmericaSouth Central AsiaSouth Eastern AsiaSouthern EuropeSpainSri LankaSt. Vincent and the GrenadinesSudanSwedenSwitzerlandSyriaTaiwanThailandTrinidad and TobagoTurkeyUgandaUkraineUruguayUzbekistanVenezuelaVietnamWest IndiesWestern AfricaWestern AsiaWestern EuropeYemenZaireZimbabweAzores
Doctorate Degree
Income
Poverty
Unemployment
Labor Participation
Family Structure
Vehicle Availability
Education Level
Disability

Doctorate Degree Comparison

Whites/Caucasians

Serbians

Fair
Excellent
1.8%
DOCTORATE DEGREE
22.8/ 100
METRIC RATING
200th/ 347
METRIC RANK
2.0%
DOCTORATE DEGREE
88.7/ 100
METRIC RATING
135th/ 347
METRIC RANK

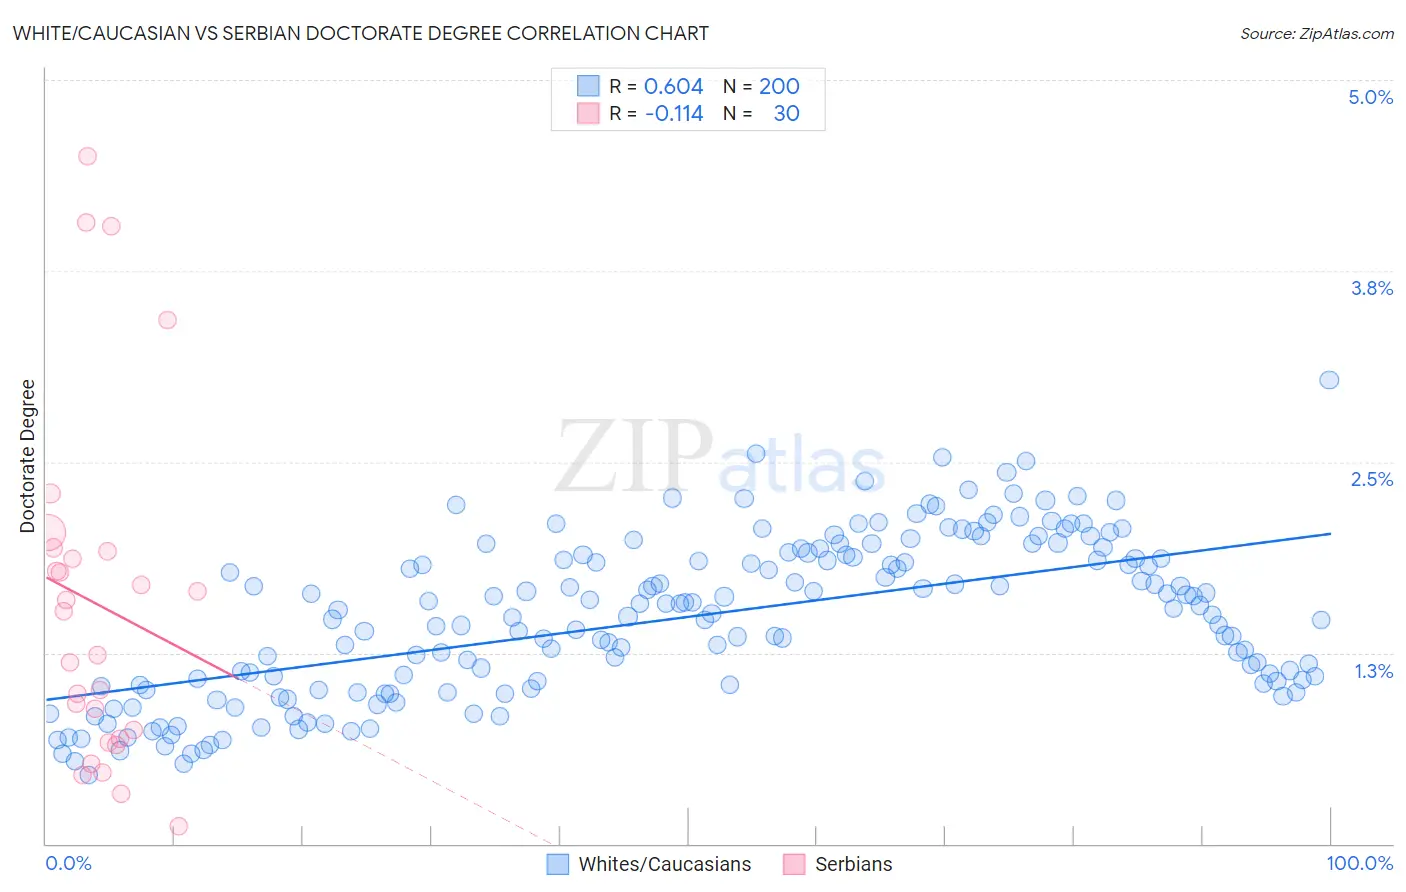
White/Caucasian vs Serbian Doctorate Degree Correlation Chart

The statistical analysis conducted on geographies consisting of 553,713,140 people shows a significant positive correlation between the proportion of Whites/Caucasians and percentage of population with at least doctorate degree education in the United States with a correlation coefficient (R) of 0.604 and weighted average of 1.8%. Similarly, the statistical analysis conducted on geographies consisting of 265,941,382 people shows a poor negative correlation between the proportion of Serbians and percentage of population with at least doctorate degree education in the United States with a correlation coefficient (R) of -0.114 and weighted average of 2.0%, a difference of 12.6%.
White/Caucasian vs Serbian Doctorate Degree

Doctorate Degree Correlation Summary

MeasurementWhite/CaucasianSerbian
Minimum0.45%0.11%
Maximum3.0%4.5%
Range2.6%4.4%
Mean1.5%1.6%
Median1.5%1.4%
Interquartile 25% (IQ1)1.0%0.69%
Interquartile 75% (IQ3)1.9%1.9%
Interquartile Range (IQR)0.85%1.2%
Standard Deviation (Sample)0.52%1.1%
Standard Deviation (Population)0.52%1.1%

Similar Demographics by Doctorate Degree

Demographics Similar to Whites/Caucasians by Doctorate Degree

In terms of doctorate degree, the demographic groups most similar to Whites/Caucasians are Immigrants from Nigeria (1.8%, a difference of 0.070%), Immigrants from South America (1.8%, a difference of 0.11%), Portuguese (1.8%, a difference of 0.29%), Immigrants from Vietnam (1.8%, a difference of 0.32%), and Somali (1.7%, a difference of 0.35%).
DemographicsRating | RankDoctorate Degree
German Russians
27.1
/100
|
#193
Fair
1.8%
Uruguayans
26.2
/100
|
#194
Fair
1.8%
Immigrants | Somalia
25.4
/100
|
#195
Fair
1.8%
Sub-Saharan Africans
25.1
/100
|
#196
Fair
1.8%
Chinese
25.1
/100
|
#197
Fair
1.8%
Immigrants | Ghana
24.6
/100
|
#198
Fair
1.8%
Immigrants | South America
23.3
/100
|
#199
Fair
1.8%
Whites/Caucasians
22.8
/100
|
#200
Fair
1.8%
Immigrants | Nigeria
22.4
/100
|
#201
Fair
1.8%
Portuguese
21.4
/100
|
#202
Fair
1.8%
Immigrants | Vietnam
21.4
/100
|
#203
Fair
1.8%
Somalis
21.2
/100
|
#204
Fair
1.7%
Venezuelans
19.5
/100
|
#205
Poor
1.7%
Immigrants | Peru
17.6
/100
|
#206
Poor
1.7%
Yugoslavians
17.1
/100
|
#207
Poor
1.7%

Demographics Similar to Serbians by Doctorate Degree

In terms of doctorate degree, the demographic groups most similar to Serbians are Immigrants from Cameroon (2.0%, a difference of 0.060%), Swedish (2.0%, a difference of 0.14%), South American Indian (2.0%, a difference of 0.15%), Immigrants from Uzbekistan (2.0%, a difference of 0.21%), and Swiss (2.0%, a difference of 0.24%).
DemographicsRating | RankDoctorate Degree
Immigrants | Zaire
91.1
/100
|
#128
Exceptional
2.0%
Canadians
90.6
/100
|
#129
Exceptional
2.0%
Immigrants | Ukraine
90.5
/100
|
#130
Exceptional
2.0%
Immigrants | Sierra Leone
90.2
/100
|
#131
Exceptional
2.0%
Scottish
89.4
/100
|
#132
Excellent
2.0%
Immigrants | Uzbekistan
89.3
/100
|
#133
Excellent
2.0%
Immigrants | Cameroon
88.9
/100
|
#134
Excellent
2.0%
Serbians
88.7
/100
|
#135
Excellent
2.0%
Swedes
88.3
/100
|
#136
Excellent
2.0%
South American Indians
88.3
/100
|
#137
Excellent
2.0%
Swiss
88.0
/100
|
#138
Excellent
2.0%
Afghans
87.2
/100
|
#139
Excellent
2.0%
Immigrants | Africa
87.0
/100
|
#140
Excellent
2.0%
Senegalese
86.7
/100
|
#141
Excellent
2.0%
Italians
86.0
/100
|
#142
Excellent
2.0%