White/Caucasian vs Czech Associate's Degree

COMPARE

White/Caucasian
Race
Ancestry
AfghanAfricanAlaska NativeAlaskan AthabascanAlbanianAleutAlsatianAmericanApacheArabArapahoArgentineanArmenianAssyrian/Chaldean/SyriacAustralianAustrianBahamianBangladeshiBarbadianBasqueBelgianBelizeanBermudanBhutaneseBlackfeetBolivianBrazilianBritishBritish West IndianBulgarianBurmeseCajunCambodianCanadianCape VerdeanCarpatho RusynCelticCentral AmericanCentral American IndianCherokeeCheyenneChickasawChileanChineseChippewaChoctawColombianColvilleComancheCosta RicanCreeCreekCroatianCrowCubanCypriotCzechoslovakianDanishDelawareDominicanDutchDutch West IndianEastern EuropeanEcuadorianEgyptianEnglishEstonianEthiopianEuropeanFijianFilipinoFinnishFrenchFrench American IndianFrench CanadianGermanGerman RussianGhanaianGreekGuamanian/ChamorroGuatemalanGuyaneseHaitianHmongHonduranHopiHoumaHungarianIcelanderIndian (Asian)IndonesianInupiatIranianIraqiIrishIroquoisIsraeliItalianJamaicanJapaneseJordanianKenyanKiowaKoreanLaotianLatvianLebaneseLiberianLithuanianLumbeeLuxembourgerMacedonianMalaysianMalteseMarshalleseMenomineeMexicanMexican American IndianMongolianMoroccanNative HawaiianNavajoNepaleseNew ZealanderNicaraguanNigerianNorthern EuropeanNorwegianOkinawanOsageOttawaPaiutePakistaniPalestinianPanamanianParaguayanPennsylvania GermanPeruvianPimaPolishPortuguesePotawatomiPuebloPuerto RicanPuget Sound SalishRomanianRussianSalvadoranSamoanScandinavianScotch-IrishScottishSeminoleSenegaleseSerbianShoshoneSierra LeoneanSiouxSlavicSlovakSloveneSomaliSouth AfricanSouth AmericanSouth American IndianSoviet UnionSpaniardSpanishSpanish AmericanSpanish American IndianSri LankanSubsaharan AfricanSudaneseSwedishSwissSyrianTaiwaneseThaiTlingit-HaidaTohono O'OdhamTonganTrinidadian and TobagonianTsimshianTurkishU.S. Virgin IslanderUgandanUkrainianUruguayanUteVenezuelanVietnameseWelshWest IndianYakamaYaquiYugoslavianYumanYup'ikZimbabwean
Immigration
NonimmigrantsImmigrantsAfghanistanAfricaAlbaniaArgentinaArmeniaAsiaAustraliaAustriaBahamasBangladeshBarbadosBelarusBelgiumBelizeBoliviaBosnia and HerzegovinaBrazilBulgariaBurma/MyanmarCabo VerdeCambodiaCameroonCanadaCaribbeanCentral AmericaChileChinaColombiaCongoCosta RicaCroatiaCubaCzechoslovakiaDenmarkDominicaDominican RepublicEastern AfricaEastern AsiaEastern EuropeEcuadorEgyptEl SalvadorEnglandEritreaEthiopiaEuropeFijiFranceGermanyGhanaGreeceGrenadaGuatemalaGuyanaHaitiHondurasHong KongHungaryIndiaIndonesiaIranIraqIrelandIsraelItalyJamaicaJapanJordanKazakhstanKenyaKoreaKuwaitLaosLatin AmericaLatviaLebanonLiberiaLithuaniaMalaysiaMexicoMicronesiaMiddle AfricaMoldovaMoroccoNepalNetherlandsNicaraguaNigeriaNorth AmericaNorth MacedoniaNorthern AfricaNorthern EuropeNorwayOceaniaPakistanPanamaPeruPhilippinesPolandPortugalRomaniaRussiaSaudi ArabiaScotlandSenegalSerbiaSierra LeoneSingaporeSomaliaSouth AfricaSouth AmericaSouth Central AsiaSouth Eastern AsiaSouthern EuropeSpainSri LankaSt. Vincent and the GrenadinesSudanSwedenSwitzerlandSyriaTaiwanThailandTrinidad and TobagoTurkeyUgandaUkraineUruguayUzbekistanVenezuelaVietnamWest IndiesWestern AfricaWestern AsiaWestern EuropeYemenZaireZimbabweAzores
Czech
Race
Ancestry
AfghanAfricanAlaska NativeAlaskan AthabascanAlbanianAleutAlsatianAmericanApacheArabArapahoArgentineanArmenianAssyrian/Chaldean/SyriacAustralianAustrianBahamianBangladeshiBarbadianBasqueBelgianBelizeanBermudanBhutaneseBlackfeetBolivianBrazilianBritishBritish West IndianBulgarianBurmeseCajunCambodianCanadianCape VerdeanCarpatho RusynCelticCentral AmericanCentral American IndianCherokeeCheyenneChickasawChileanChineseChippewaChoctawColombianColvilleComancheCosta RicanCreeCreekCroatianCrowCubanCypriotCzechCzechoslovakianDanishDelawareDominicanDutchDutch West IndianEastern EuropeanEcuadorianEgyptianEnglishEstonianEthiopianEuropeanFijianFilipinoFinnishFrenchFrench American IndianFrench CanadianGermanGerman RussianGhanaianGreekGuamanian/ChamorroGuatemalanGuyaneseHaitianHmongHonduranHopiHoumaHungarianIcelanderIndian (Asian)IndonesianInupiatIranianIraqiIrishIroquoisIsraeliItalianJamaicanJapaneseJordanianKenyanKiowaKoreanLaotianLatvianLebaneseLiberianLithuanianLumbeeLuxembourgerMacedonianMalaysianMalteseMarshalleseMenomineeMexicanMexican American IndianMongolianMoroccanNative HawaiianNavajoNepaleseNew ZealanderNicaraguanNigerianNorthern EuropeanNorwegianOkinawanOsageOttawaPaiutePakistaniPalestinianPanamanianParaguayanPennsylvania GermanPeruvianPimaPolishPortuguesePotawatomiPuebloPuerto RicanPuget Sound SalishRomanianRussianSalvadoranSamoanScandinavianScotch-IrishScottishSeminoleSenegaleseSerbianShoshoneSierra LeoneanSiouxSlavicSlovakSloveneSomaliSouth AfricanSouth AmericanSouth American IndianSoviet UnionSpaniardSpanishSpanish AmericanSpanish American IndianSri LankanSubsaharan AfricanSudaneseSwedishSwissSyrianTaiwaneseThaiTlingit-HaidaTohono O'OdhamTonganTrinidadian and TobagonianTsimshianTurkishU.S. Virgin IslanderUgandanUkrainianUruguayanUteVenezuelanVietnameseWelshWest IndianYakamaYaquiYugoslavianYumanYup'ikZimbabwean
Immigration
NonimmigrantsImmigrantsAfghanistanAfricaAlbaniaArgentinaArmeniaAsiaAustraliaAustriaBahamasBangladeshBarbadosBelarusBelgiumBelizeBoliviaBosnia and HerzegovinaBrazilBulgariaBurma/MyanmarCabo VerdeCambodiaCameroonCanadaCaribbeanCentral AmericaChileChinaColombiaCongoCosta RicaCroatiaCubaCzechoslovakiaDenmarkDominicaDominican RepublicEastern AfricaEastern AsiaEastern EuropeEcuadorEgyptEl SalvadorEnglandEritreaEthiopiaEuropeFijiFranceGermanyGhanaGreeceGrenadaGuatemalaGuyanaHaitiHondurasHong KongHungaryIndiaIndonesiaIranIraqIrelandIsraelItalyJamaicaJapanJordanKazakhstanKenyaKoreaKuwaitLaosLatin AmericaLatviaLebanonLiberiaLithuaniaMalaysiaMexicoMicronesiaMiddle AfricaMoldovaMoroccoNepalNetherlandsNicaraguaNigeriaNorth AmericaNorth MacedoniaNorthern AfricaNorthern EuropeNorwayOceaniaPakistanPanamaPeruPhilippinesPolandPortugalRomaniaRussiaSaudi ArabiaScotlandSenegalSerbiaSierra LeoneSingaporeSomaliaSouth AfricaSouth AmericaSouth Central AsiaSouth Eastern AsiaSouthern EuropeSpainSri LankaSt. Vincent and the GrenadinesSudanSwedenSwitzerlandSyriaTaiwanThailandTrinidad and TobagoTurkeyUgandaUkraineUruguayUzbekistanVenezuelaVietnamWest IndiesWestern AfricaWestern AsiaWestern EuropeYemenZaireZimbabweAzores
Associate's Degree
Income
Poverty
Unemployment
Labor Participation
Family Structure
Vehicle Availability
Education Level
Disability

Associate's Degree Comparison

Whites/Caucasians

Czechs

Tragic
Good
44.2%
ASSOCIATE'S DEGREE
7.5/ 100
METRIC RATING
219th/ 347
METRIC RANK
47.2%
ASSOCIATE'S DEGREE
72.2/ 100
METRIC RATING
153rd/ 347
METRIC RANK

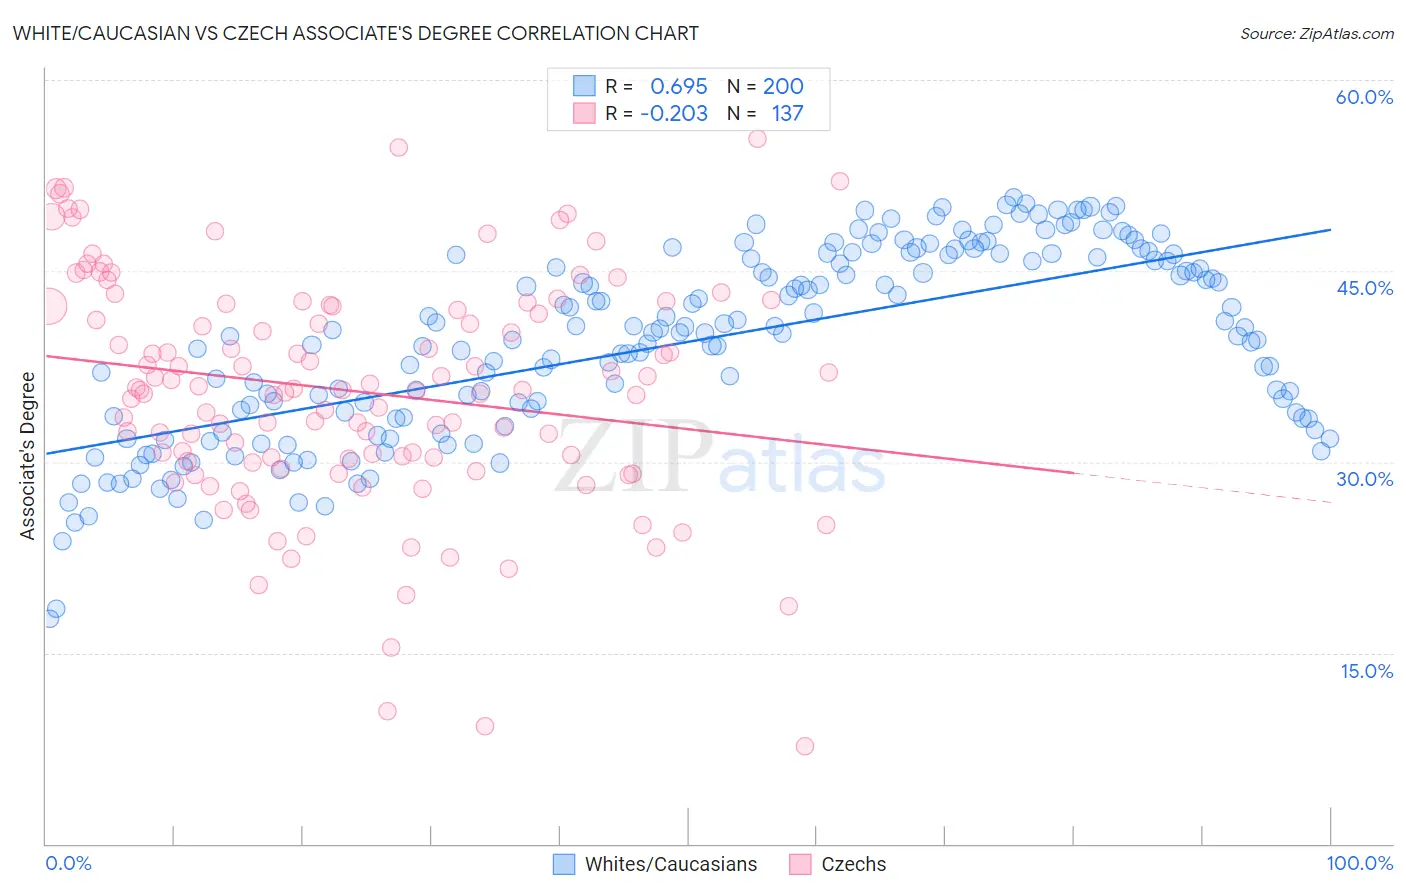
White/Caucasian vs Czech Associate's Degree Correlation Chart

The statistical analysis conducted on geographies consisting of 584,984,374 people shows a significant positive correlation between the proportion of Whites/Caucasians and percentage of population with at least associate's degree education in the United States with a correlation coefficient (R) of 0.695 and weighted average of 44.2%. Similarly, the statistical analysis conducted on geographies consisting of 484,784,602 people shows a weak negative correlation between the proportion of Czechs and percentage of population with at least associate's degree education in the United States with a correlation coefficient (R) of -0.203 and weighted average of 47.2%, a difference of 6.8%.
White/Caucasian vs Czech Associate's Degree

Associate's Degree Correlation Summary

MeasurementWhite/CaucasianCzech
Minimum17.7%7.7%
Maximum50.8%55.4%
Range33.1%47.7%
Mean39.4%35.6%
Median40.2%35.7%
Interquartile 25% (IQ1)33.5%30.1%
Interquartile 75% (IQ3)46.2%42.3%
Interquartile Range (IQR)12.6%12.2%
Standard Deviation (Sample)7.3%9.1%
Standard Deviation (Population)7.3%9.0%

Similar Demographics by Associate's Degree

Demographics Similar to Whites/Caucasians by Associate's Degree

In terms of associate's degree, the demographic groups most similar to Whites/Caucasians are Portuguese (44.1%, a difference of 0.070%), Immigrants from Western Africa (44.1%, a difference of 0.27%), Spanish (44.4%, a difference of 0.48%), Barbadian (43.9%, a difference of 0.54%), and Subsaharan African (43.9%, a difference of 0.64%).
DemographicsRating | RankAssociate's Degree
French Canadians
15.0
/100
|
#212
Poor
44.9%
Immigrants | Ghana
14.2
/100
|
#213
Poor
44.8%
Immigrants | Middle Africa
12.7
/100
|
#214
Poor
44.7%
Immigrants | Panama
12.4
/100
|
#215
Poor
44.7%
Immigrants | Nigeria
11.4
/100
|
#216
Poor
44.6%
Immigrants | Immigrants
10.5
/100
|
#217
Poor
44.5%
Spanish
9.4
/100
|
#218
Tragic
44.4%
Whites/Caucasians
7.5
/100
|
#219
Tragic
44.2%
Portuguese
7.2
/100
|
#220
Tragic
44.1%
Immigrants | Western Africa
6.6
/100
|
#221
Tragic
44.1%
Barbadians
5.8
/100
|
#222
Tragic
43.9%
Sub-Saharan Africans
5.5
/100
|
#223
Tragic
43.9%
West Indians
5.2
/100
|
#224
Tragic
43.8%
Guamanians/Chamorros
4.8
/100
|
#225
Tragic
43.8%
Immigrants | Burma/Myanmar
4.3
/100
|
#226
Tragic
43.7%

Demographics Similar to Czechs by Associate's Degree

In terms of associate's degree, the demographic groups most similar to Czechs are Immigrants from Kenya (47.2%, a difference of 0.010%), Kenyan (47.1%, a difference of 0.14%), South American (47.1%, a difference of 0.16%), Sudanese (47.1%, a difference of 0.18%), and Immigrants from Afghanistan (47.3%, a difference of 0.19%).
DemographicsRating | RankAssociate's Degree
Immigrants | Sudan
77.9
/100
|
#146
Good
47.4%
Danes
77.3
/100
|
#147
Good
47.4%
South American Indians
76.7
/100
|
#148
Good
47.4%
Immigrants | Armenia
76.6
/100
|
#149
Good
47.4%
Iraqis
76.2
/100
|
#150
Good
47.4%
Immigrants | North Macedonia
76.0
/100
|
#151
Good
47.4%
Immigrants | Afghanistan
74.3
/100
|
#152
Good
47.3%
Czechs
72.2
/100
|
#153
Good
47.2%
Immigrants | Kenya
72.1
/100
|
#154
Good
47.2%
Kenyans
70.6
/100
|
#155
Good
47.1%
South Americans
70.5
/100
|
#156
Good
47.1%
Sudanese
70.3
/100
|
#157
Good
47.1%
Immigrants | Germany
69.7
/100
|
#158
Good
47.1%
Immigrants | Poland
69.2
/100
|
#159
Good
47.1%
Scottish
65.4
/100
|
#160
Good
46.9%