West Indian vs Puget Sound Salish Kindergarten

COMPARE

West Indian
Race
Ancestry
AfghanAfricanAlaska NativeAlaskan AthabascanAlbanianAleutAlsatianAmericanApacheArabArapahoArgentineanArmenianAssyrian/Chaldean/SyriacAustralianAustrianBahamianBangladeshiBarbadianBasqueBelgianBelizeanBermudanBhutaneseBlackfeetBolivianBrazilianBritishBritish West IndianBulgarianBurmeseCajunCambodianCanadianCape VerdeanCarpatho RusynCelticCentral AmericanCentral American IndianCherokeeCheyenneChickasawChileanChineseChippewaChoctawColombianColvilleComancheCosta RicanCreeCreekCroatianCrowCubanCypriotCzechCzechoslovakianDanishDelawareDominicanDutchDutch West IndianEastern EuropeanEcuadorianEgyptianEnglishEstonianEthiopianEuropeanFijianFilipinoFinnishFrenchFrench American IndianFrench CanadianGermanGerman RussianGhanaianGreekGuamanian/ChamorroGuatemalanGuyaneseHaitianHmongHonduranHopiHoumaHungarianIcelanderIndian (Asian)IndonesianInupiatIranianIraqiIrishIroquoisIsraeliItalianJamaicanJapaneseJordanianKenyanKiowaKoreanLaotianLatvianLebaneseLiberianLithuanianLumbeeLuxembourgerMacedonianMalaysianMalteseMarshalleseMenomineeMexicanMexican American IndianMongolianMoroccanNative HawaiianNavajoNepaleseNew ZealanderNicaraguanNigerianNorthern EuropeanNorwegianOkinawanOsageOttawaPaiutePakistaniPalestinianPanamanianParaguayanPennsylvania GermanPeruvianPimaPolishPortuguesePotawatomiPuebloPuerto RicanRomanianRussianSalvadoranSamoanScandinavianScotch-IrishScottishSeminoleSenegaleseSerbianShoshoneSierra LeoneanSiouxSlavicSlovakSloveneSomaliSouth AfricanSouth AmericanSouth American IndianSoviet UnionSpaniardSpanishSpanish AmericanSpanish American IndianSri LankanSubsaharan AfricanSudaneseSwedishSwissSyrianTaiwaneseThaiTlingit-HaidaTohono O'OdhamTonganTrinidadian and TobagonianTsimshianTurkishU.S. Virgin IslanderUgandanUkrainianUruguayanUteVenezuelanVietnameseWelshWest IndianYakamaYaquiYugoslavianYumanYup'ikZimbabwean
Immigration
NonimmigrantsImmigrantsAfghanistanAfricaAlbaniaArgentinaArmeniaAsiaAustraliaAustriaBahamasBangladeshBarbadosBelarusBelgiumBelizeBoliviaBosnia and HerzegovinaBrazilBulgariaBurma/MyanmarCabo VerdeCambodiaCameroonCanadaCaribbeanCentral AmericaChileChinaColombiaCongoCosta RicaCroatiaCubaCzechoslovakiaDenmarkDominicaDominican RepublicEastern AfricaEastern AsiaEastern EuropeEcuadorEgyptEl SalvadorEnglandEritreaEthiopiaEuropeFijiFranceGermanyGhanaGreeceGrenadaGuatemalaGuyanaHaitiHondurasHong KongHungaryIndiaIndonesiaIranIraqIrelandIsraelItalyJamaicaJapanJordanKazakhstanKenyaKoreaKuwaitLaosLatin AmericaLatviaLebanonLiberiaLithuaniaMalaysiaMexicoMicronesiaMiddle AfricaMoldovaMoroccoNepalNetherlandsNicaraguaNigeriaNorth AmericaNorth MacedoniaNorthern AfricaNorthern EuropeNorwayOceaniaPakistanPanamaPeruPhilippinesPolandPortugalRomaniaRussiaSaudi ArabiaScotlandSenegalSerbiaSierra LeoneSingaporeSomaliaSouth AfricaSouth AmericaSouth Central AsiaSouth Eastern AsiaSouthern EuropeSpainSri LankaSt. Vincent and the GrenadinesSudanSwedenSwitzerlandSyriaTaiwanThailandTrinidad and TobagoTurkeyUgandaUkraineUruguayUzbekistanVenezuelaVietnamWest IndiesWestern AfricaWestern AsiaWestern EuropeYemenZaireZimbabweAzores
Puget Sound Salish
Race
Ancestry
AfghanAfricanAlaska NativeAlaskan AthabascanAlbanianAleutAlsatianAmericanApacheArabArapahoArgentineanArmenianAssyrian/Chaldean/SyriacAustralianAustrianBahamianBangladeshiBarbadianBasqueBelgianBelizeanBermudanBhutaneseBlackfeetBolivianBrazilianBritishBritish West IndianBulgarianBurmeseCajunCambodianCanadianCape VerdeanCarpatho RusynCelticCentral AmericanCentral American IndianCherokeeCheyenneChickasawChileanChineseChippewaChoctawColombianColvilleComancheCosta RicanCreeCreekCroatianCrowCubanCypriotCzechCzechoslovakianDanishDelawareDominicanDutchDutch West IndianEastern EuropeanEcuadorianEgyptianEnglishEstonianEthiopianEuropeanFijianFilipinoFinnishFrenchFrench American IndianFrench CanadianGermanGerman RussianGhanaianGreekGuamanian/ChamorroGuatemalanGuyaneseHaitianHmongHonduranHopiHoumaHungarianIcelanderIndian (Asian)IndonesianInupiatIranianIraqiIrishIroquoisIsraeliItalianJamaicanJapaneseJordanianKenyanKiowaKoreanLaotianLatvianLebaneseLiberianLithuanianLumbeeLuxembourgerMacedonianMalaysianMalteseMarshalleseMenomineeMexicanMexican American IndianMongolianMoroccanNative HawaiianNavajoNepaleseNew ZealanderNicaraguanNigerianNorthern EuropeanNorwegianOkinawanOsageOttawaPaiutePakistaniPalestinianPanamanianParaguayanPennsylvania GermanPeruvianPimaPolishPortuguesePotawatomiPuebloPuerto RicanPuget Sound SalishRomanianRussianSalvadoranSamoanScandinavianScotch-IrishScottishSeminoleSenegaleseSerbianShoshoneSierra LeoneanSiouxSlavicSlovakSloveneSomaliSouth AfricanSouth AmericanSouth American IndianSoviet UnionSpaniardSpanishSpanish AmericanSpanish American IndianSri LankanSubsaharan AfricanSudaneseSwedishSwissSyrianTaiwaneseThaiTlingit-HaidaTohono O'OdhamTonganTrinidadian and TobagonianTsimshianTurkishU.S. Virgin IslanderUgandanUkrainianUruguayanUteVenezuelanVietnameseWelshYakamaYaquiYugoslavianYumanYup'ikZimbabwean
Immigration
NonimmigrantsImmigrantsAfghanistanAfricaAlbaniaArgentinaArmeniaAsiaAustraliaAustriaBahamasBangladeshBarbadosBelarusBelgiumBelizeBoliviaBosnia and HerzegovinaBrazilBulgariaBurma/MyanmarCabo VerdeCambodiaCameroonCanadaCaribbeanCentral AmericaChileChinaColombiaCongoCosta RicaCroatiaCubaCzechoslovakiaDenmarkDominicaDominican RepublicEastern AfricaEastern AsiaEastern EuropeEcuadorEgyptEl SalvadorEnglandEritreaEthiopiaEuropeFijiFranceGermanyGhanaGreeceGrenadaGuatemalaGuyanaHaitiHondurasHong KongHungaryIndiaIndonesiaIranIraqIrelandIsraelItalyJamaicaJapanJordanKazakhstanKenyaKoreaKuwaitLaosLatin AmericaLatviaLebanonLiberiaLithuaniaMalaysiaMexicoMicronesiaMiddle AfricaMoldovaMoroccoNepalNetherlandsNicaraguaNigeriaNorth AmericaNorth MacedoniaNorthern AfricaNorthern EuropeNorwayOceaniaPakistanPanamaPeruPhilippinesPolandPortugalRomaniaRussiaSaudi ArabiaScotlandSenegalSerbiaSierra LeoneSingaporeSomaliaSouth AfricaSouth AmericaSouth Central AsiaSouth Eastern AsiaSouthern EuropeSpainSri LankaSt. Vincent and the GrenadinesSudanSwedenSwitzerlandSyriaTaiwanThailandTrinidad and TobagoTurkeyUgandaUkraineUruguayUzbekistanVenezuelaVietnamWest IndiesWestern AfricaWestern AsiaWestern EuropeYemenZaireZimbabweAzores
Kindergarten
Income
Poverty
Unemployment
Labor Participation
Family Structure
Vehicle Availability
Education Level
Disability

Kindergarten Comparison

West Indians

Puget Sound Salish

Tragic
Exceptional
97.5%
KINDERGARTEN
0.3/ 100
METRIC RATING
269th/ 347
METRIC RANK
98.2%
KINDERGARTEN
98.1/ 100
METRIC RATING
100th/ 347
METRIC RANK

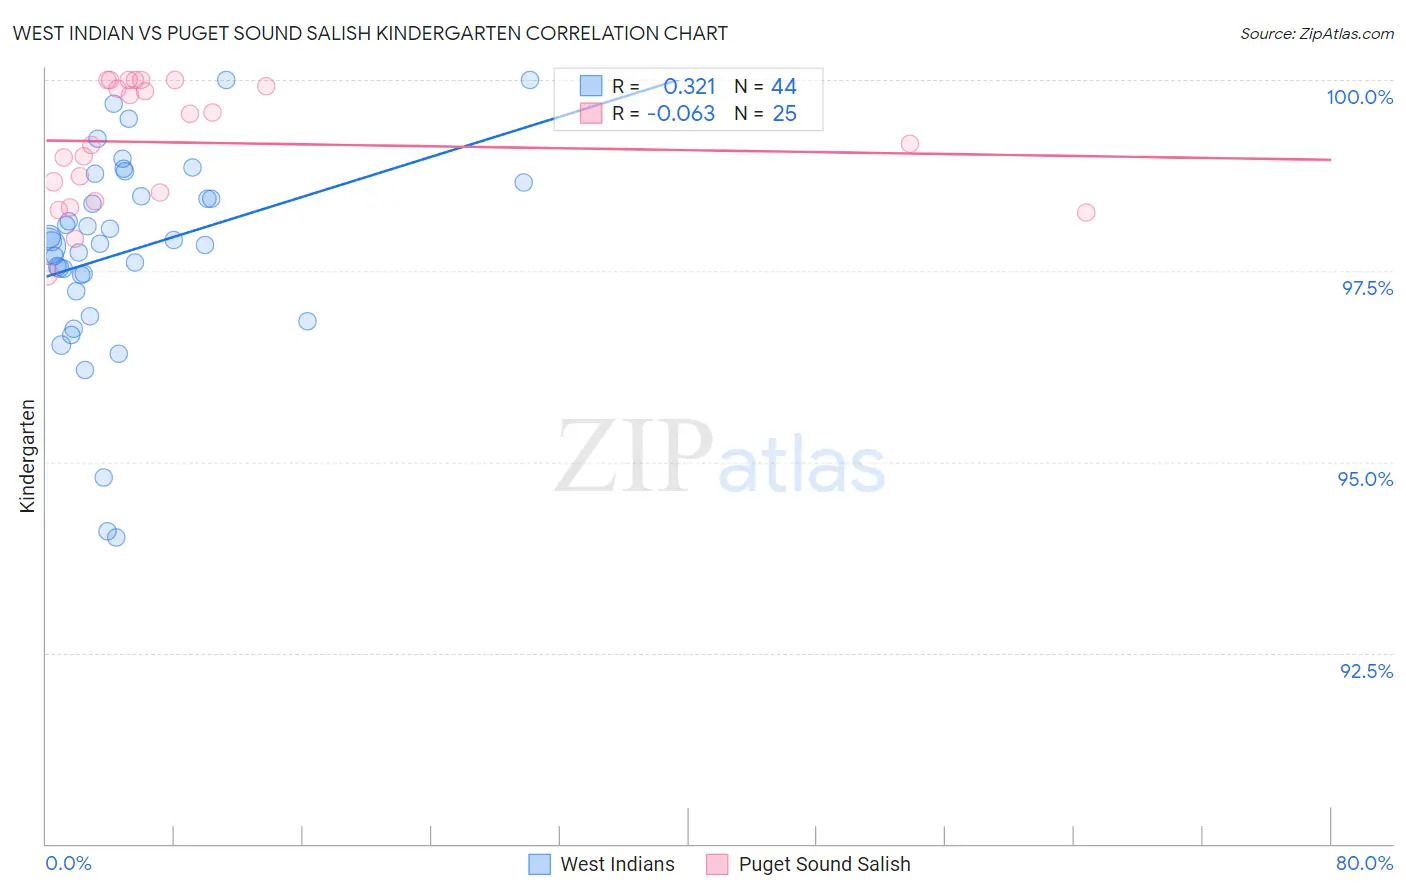
West Indian vs Puget Sound Salish Kindergarten Correlation Chart

The statistical analysis conducted on geographies consisting of 254,063,654 people shows a mild positive correlation between the proportion of West Indians and percentage of population with at least kindergarten education in the United States with a correlation coefficient (R) of 0.321 and weighted average of 97.5%. Similarly, the statistical analysis conducted on geographies consisting of 46,155,746 people shows a slight negative correlation between the proportion of Puget Sound Salish and percentage of population with at least kindergarten education in the United States with a correlation coefficient (R) of -0.063 and weighted average of 98.2%, a difference of 0.76%.
West Indian vs Puget Sound Salish Kindergarten

Kindergarten Correlation Summary

MeasurementWest IndianPuget Sound Salish
Minimum94.0%97.5%
Maximum100.0%100.0%
Range6.0%2.5%
Mean97.8%99.2%
Median97.9%99.2%
Interquartile 25% (IQ1)97.3%98.5%
Interquartile 75% (IQ3)98.6%100.0%
Interquartile Range (IQR)1.2%1.5%
Standard Deviation (Sample)1.3%0.78%
Standard Deviation (Population)1.3%0.76%

Similar Demographics by Kindergarten

Demographics Similar to West Indians by Kindergarten

In terms of kindergarten, the demographic groups most similar to West Indians are Immigrants from Liberia (97.5%, a difference of 0.010%), Immigrants from Nigeria (97.5%, a difference of 0.010%), Cuban (97.5%, a difference of 0.020%), Immigrants from Sierra Leone (97.5%, a difference of 0.020%), and Immigrants from Jamaica (97.5%, a difference of 0.020%).
DemographicsRating | RankKindergarten
Immigrants | Ethiopia
0.4
/100
|
#262
Tragic
97.5%
Immigrants | South America
0.4
/100
|
#263
Tragic
97.5%
Assyrians/Chaldeans/Syriacs
0.4
/100
|
#264
Tragic
97.5%
Cubans
0.3
/100
|
#265
Tragic
97.5%
Immigrants | Sierra Leone
0.3
/100
|
#266
Tragic
97.5%
Immigrants | Liberia
0.3
/100
|
#267
Tragic
97.5%
Immigrants | Nigeria
0.3
/100
|
#268
Tragic
97.5%
West Indians
0.3
/100
|
#269
Tragic
97.5%
Immigrants | Jamaica
0.2
/100
|
#270
Tragic
97.5%
Immigrants | Peru
0.2
/100
|
#271
Tragic
97.5%
Immigrants | Bolivia
0.2
/100
|
#272
Tragic
97.5%
Immigrants | China
0.1
/100
|
#273
Tragic
97.4%
Immigrants | Cameroon
0.1
/100
|
#274
Tragic
97.4%
Ghanaians
0.1
/100
|
#275
Tragic
97.4%
Immigrants | Philippines
0.1
/100
|
#276
Tragic
97.4%

Demographics Similar to Puget Sound Salish by Kindergarten

In terms of kindergarten, the demographic groups most similar to Puget Sound Salish are Nonimmigrants (98.3%, a difference of 0.010%), Cypriot (98.3%, a difference of 0.010%), Choctaw (98.3%, a difference of 0.010%), Colville (98.3%, a difference of 0.010%), and Romanian (98.2%, a difference of 0.010%).
DemographicsRating | RankKindergarten
Immigrants | India
98.6
/100
|
#93
Exceptional
98.3%
South Africans
98.5
/100
|
#94
Exceptional
98.3%
Immigrants | Germany
98.5
/100
|
#95
Exceptional
98.3%
Immigrants | Nonimmigrants
98.3
/100
|
#96
Exceptional
98.3%
Cypriots
98.3
/100
|
#97
Exceptional
98.3%
Choctaw
98.2
/100
|
#98
Exceptional
98.3%
Colville
98.2
/100
|
#99
Exceptional
98.3%
Puget Sound Salish
98.1
/100
|
#100
Exceptional
98.2%
Romanians
97.8
/100
|
#101
Exceptional
98.2%
Cree
97.7
/100
|
#102
Exceptional
98.2%
Immigrants | Ireland
97.6
/100
|
#103
Exceptional
98.2%
Bhutanese
97.3
/100
|
#104
Exceptional
98.2%
Pima
97.3
/100
|
#105
Exceptional
98.2%
Basques
97.3
/100
|
#106
Exceptional
98.2%
Turks
97.3
/100
|
#107
Exceptional
98.2%