West Indian vs Cambodian 4th Grade
COMPARE
West Indian
Cambodian
4th Grade
4th Grade Comparison
West Indians
Cambodians
97.0%
4TH GRADE
0.4/ 100
METRIC RATING
262nd/ 347
METRIC RANK
97.7%
4TH GRADE
87.8/ 100
METRIC RATING
135th/ 347
METRIC RANK
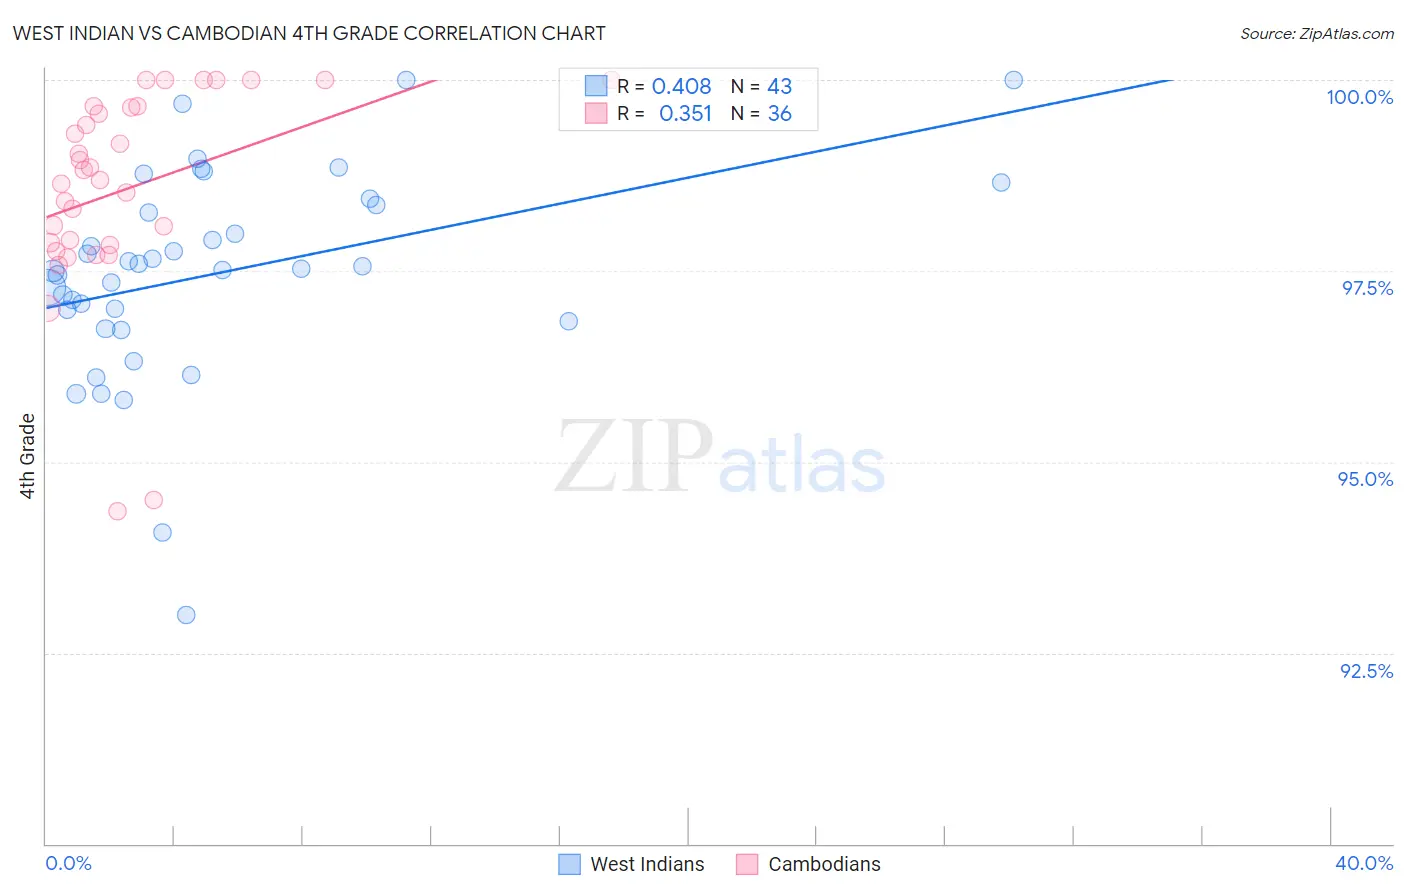
West Indian vs Cambodian 4th Grade Correlation Chart
The statistical analysis conducted on geographies consisting of 254,059,006 people shows a moderate positive correlation between the proportion of West Indians and percentage of population with at least 4th grade education in the United States with a correlation coefficient (R) of 0.408 and weighted average of 97.0%. Similarly, the statistical analysis conducted on geographies consisting of 102,511,743 people shows a mild positive correlation between the proportion of Cambodians and percentage of population with at least 4th grade education in the United States with a correlation coefficient (R) of 0.351 and weighted average of 97.7%, a difference of 0.72%.
4th Grade Correlation Summary
| Measurement | West Indian | Cambodian |
| Minimum | 93.0% | 94.4% |
| Maximum | 100.0% | 100.0% |
| Range | 7.0% | 5.6% |
| Mean | 97.5% | 98.6% |
| Median | 97.5% | 98.8% |
| Interquartile 25% (IQ1) | 96.8% | 97.9% |
| Interquartile 75% (IQ3) | 98.4% | 99.6% |
| Interquartile Range (IQR) | 1.5% | 1.8% |
| Standard Deviation (Sample) | 1.4% | 1.3% |
| Standard Deviation (Population) | 1.4% | 1.3% |
Similar Demographics by 4th Grade
Demographics Similar to West Indians by 4th Grade
In terms of 4th grade, the demographic groups most similar to West Indians are Immigrants from Jamaica (97.0%, a difference of 0.0%), Immigrants from Sierra Leone (97.0%, a difference of 0.010%), Immigrants from South America (97.0%, a difference of 0.010%), Taiwanese (97.0%, a difference of 0.010%), and Immigrants from Ethiopia (97.0%, a difference of 0.020%).
| Demographics | Rating | Rank | 4th Grade |
| Peruvians | 0.7 /100 | #255 | Tragic 97.1% |
| Bolivians | 0.7 /100 | #256 | Tragic 97.1% |
| Immigrants | Congo | 0.5 /100 | #257 | Tragic 97.0% |
| Immigrants | Colombia | 0.5 /100 | #258 | Tragic 97.0% |
| Immigrants | Ethiopia | 0.4 /100 | #259 | Tragic 97.0% |
| Immigrants | Sierra Leone | 0.4 /100 | #260 | Tragic 97.0% |
| Immigrants | South America | 0.4 /100 | #261 | Tragic 97.0% |
| West Indians | 0.4 /100 | #262 | Tragic 97.0% |
| Immigrants | Jamaica | 0.3 /100 | #263 | Tragic 97.0% |
| Taiwanese | 0.3 /100 | #264 | Tragic 97.0% |
| Armenians | 0.3 /100 | #265 | Tragic 97.0% |
| Immigrants | China | 0.3 /100 | #266 | Tragic 97.0% |
| Immigrants | Nigeria | 0.3 /100 | #267 | Tragic 97.0% |
| Ghanaians | 0.2 /100 | #268 | Tragic 97.0% |
| Immigrants | Uzbekistan | 0.2 /100 | #269 | Tragic 96.9% |
Demographics Similar to Cambodians by 4th Grade
In terms of 4th grade, the demographic groups most similar to Cambodians are Hmong (97.7%, a difference of 0.0%), Palestinian (97.7%, a difference of 0.0%), Immigrants from Hungary (97.7%, a difference of 0.010%), Israeli (97.7%, a difference of 0.010%), and Immigrants from Kuwait (97.7%, a difference of 0.020%).
| Demographics | Rating | Rank | 4th Grade |
| Pima | 92.0 /100 | #128 | Exceptional 97.7% |
| Immigrants | Bulgaria | 91.3 /100 | #129 | Exceptional 97.7% |
| Immigrants | Romania | 90.6 /100 | #130 | Exceptional 97.7% |
| Immigrants | Kuwait | 89.7 /100 | #131 | Excellent 97.7% |
| Immigrants | Hungary | 89.3 /100 | #132 | Excellent 97.7% |
| Hmong | 88.2 /100 | #133 | Excellent 97.7% |
| Palestinians | 88.1 /100 | #134 | Excellent 97.7% |
| Cambodians | 87.8 /100 | #135 | Excellent 97.7% |
| Israelis | 86.2 /100 | #136 | Excellent 97.7% |
| Immigrants | Turkey | 86.0 /100 | #137 | Excellent 97.7% |
| Blackfeet | 86.0 /100 | #138 | Excellent 97.7% |
| Seminole | 84.7 /100 | #139 | Excellent 97.7% |
| Filipinos | 84.0 /100 | #140 | Excellent 97.7% |
| Immigrants | Greece | 83.8 /100 | #141 | Excellent 97.7% |
| Immigrants | North Macedonia | 83.3 /100 | #142 | Excellent 97.7% |