Vietnamese vs Spanish American Professional Degree
COMPARE
Vietnamese
Spanish American
Professional Degree
Professional Degree Comparison
Vietnamese
Spanish Americans
4.5%
PROFESSIONAL DEGREE
68.4/ 100
METRIC RATING
159th/ 347
METRIC RANK
3.9%
PROFESSIONAL DEGREE
3.8/ 100
METRIC RATING
236th/ 347
METRIC RANK
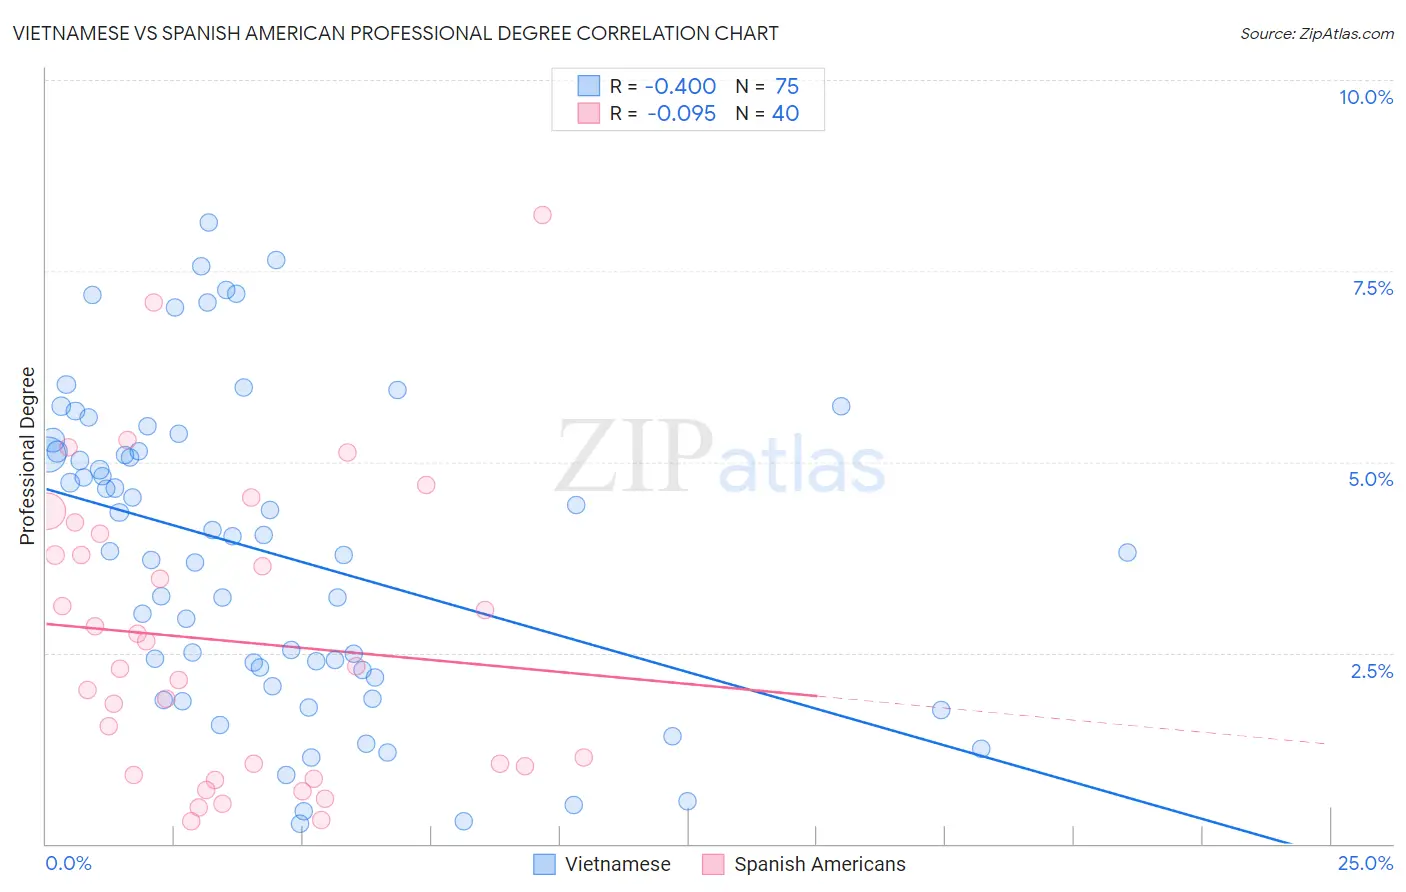
Vietnamese vs Spanish American Professional Degree Correlation Chart
The statistical analysis conducted on geographies consisting of 170,674,020 people shows a moderate negative correlation between the proportion of Vietnamese and percentage of population with at least professional degree education in the United States with a correlation coefficient (R) of -0.400 and weighted average of 4.5%. Similarly, the statistical analysis conducted on geographies consisting of 103,063,360 people shows a slight negative correlation between the proportion of Spanish Americans and percentage of population with at least professional degree education in the United States with a correlation coefficient (R) of -0.095 and weighted average of 3.9%, a difference of 16.4%.
Professional Degree Correlation Summary
| Measurement | Vietnamese | Spanish American |
| Minimum | 0.26% | 0.30% |
| Maximum | 8.1% | 8.2% |
| Range | 7.9% | 7.9% |
| Mean | 3.8% | 2.7% |
| Median | 3.8% | 2.3% |
| Interquartile 25% (IQ1) | 2.2% | 0.95% |
| Interquartile 75% (IQ3) | 5.1% | 3.9% |
| Interquartile Range (IQR) | 3.0% | 3.0% |
| Standard Deviation (Sample) | 2.0% | 1.9% |
| Standard Deviation (Population) | 2.0% | 1.9% |
Similar Demographics by Professional Degree
Demographics Similar to Vietnamese by Professional Degree
In terms of professional degree, the demographic groups most similar to Vietnamese are Immigrants from Senegal (4.5%, a difference of 0.060%), Immigrants from Armenia (4.5%, a difference of 0.080%), Assyrian/Chaldean/Syriac (4.5%, a difference of 0.16%), Iraqi (4.5%, a difference of 0.24%), and Swedish (4.5%, a difference of 0.26%).
| Demographics | Rating | Rank | Professional Degree |
| Immigrants | Africa | 72.5 /100 | #152 | Good 4.6% |
| Immigrants | Uruguay | 72.5 /100 | #153 | Good 4.6% |
| Scottish | 71.8 /100 | #154 | Good 4.6% |
| Slavs | 70.8 /100 | #155 | Good 4.5% |
| Swedes | 69.9 /100 | #156 | Good 4.5% |
| Iraqis | 69.8 /100 | #157 | Good 4.5% |
| Immigrants | Armenia | 68.8 /100 | #158 | Good 4.5% |
| Vietnamese | 68.4 /100 | #159 | Good 4.5% |
| Immigrants | Senegal | 68.0 /100 | #160 | Good 4.5% |
| Assyrians/Chaldeans/Syriacs | 67.4 /100 | #161 | Good 4.5% |
| Peruvians | 65.2 /100 | #162 | Good 4.5% |
| Sierra Leoneans | 64.3 /100 | #163 | Good 4.5% |
| Swiss | 61.0 /100 | #164 | Good 4.5% |
| Costa Ricans | 59.9 /100 | #165 | Average 4.5% |
| Immigrants | Colombia | 59.4 /100 | #166 | Average 4.5% |
Demographics Similar to Spanish Americans by Professional Degree
In terms of professional degree, the demographic groups most similar to Spanish Americans are Immigrants from Trinidad and Tobago (3.9%, a difference of 0.070%), Immigrants from Barbados (3.9%, a difference of 0.22%), Nonimmigrants (3.9%, a difference of 0.23%), Immigrants from Philippines (3.9%, a difference of 0.28%), and Cree (3.9%, a difference of 0.53%).
| Demographics | Rating | Rank | Professional Degree |
| Immigrants | Burma/Myanmar | 5.4 /100 | #229 | Tragic 3.9% |
| Nicaraguans | 5.1 /100 | #230 | Tragic 3.9% |
| Ecuadorians | 4.6 /100 | #231 | Tragic 3.9% |
| Cree | 4.3 /100 | #232 | Tragic 3.9% |
| Immigrants | Philippines | 4.1 /100 | #233 | Tragic 3.9% |
| Immigrants | Nonimmigrants | 4.0 /100 | #234 | Tragic 3.9% |
| Immigrants | Barbados | 4.0 /100 | #235 | Tragic 3.9% |
| Spanish Americans | 3.8 /100 | #236 | Tragic 3.9% |
| Immigrants | Trinidad and Tobago | 3.8 /100 | #237 | Tragic 3.9% |
| Colville | 2.6 /100 | #238 | Tragic 3.8% |
| British West Indians | 2.4 /100 | #239 | Tragic 3.8% |
| Immigrants | Ecuador | 2.3 /100 | #240 | Tragic 3.8% |
| Alaskan Athabascans | 2.3 /100 | #241 | Tragic 3.8% |
| Native Hawaiians | 2.3 /100 | #242 | Tragic 3.8% |
| Guamanians/Chamorros | 2.2 /100 | #243 | Tragic 3.8% |