Venezuelan vs Alsatian High School Diploma
COMPARE
Venezuelan
Alsatian
High School Diploma
High School Diploma Comparison
Venezuelans
Alsatians
89.1%
HIGH SCHOOL DIPLOMA
43.6/ 100
METRIC RATING
181st/ 347
METRIC RANK
89.4%
HIGH SCHOOL DIPLOMA
66.8/ 100
METRIC RATING
154th/ 347
METRIC RANK
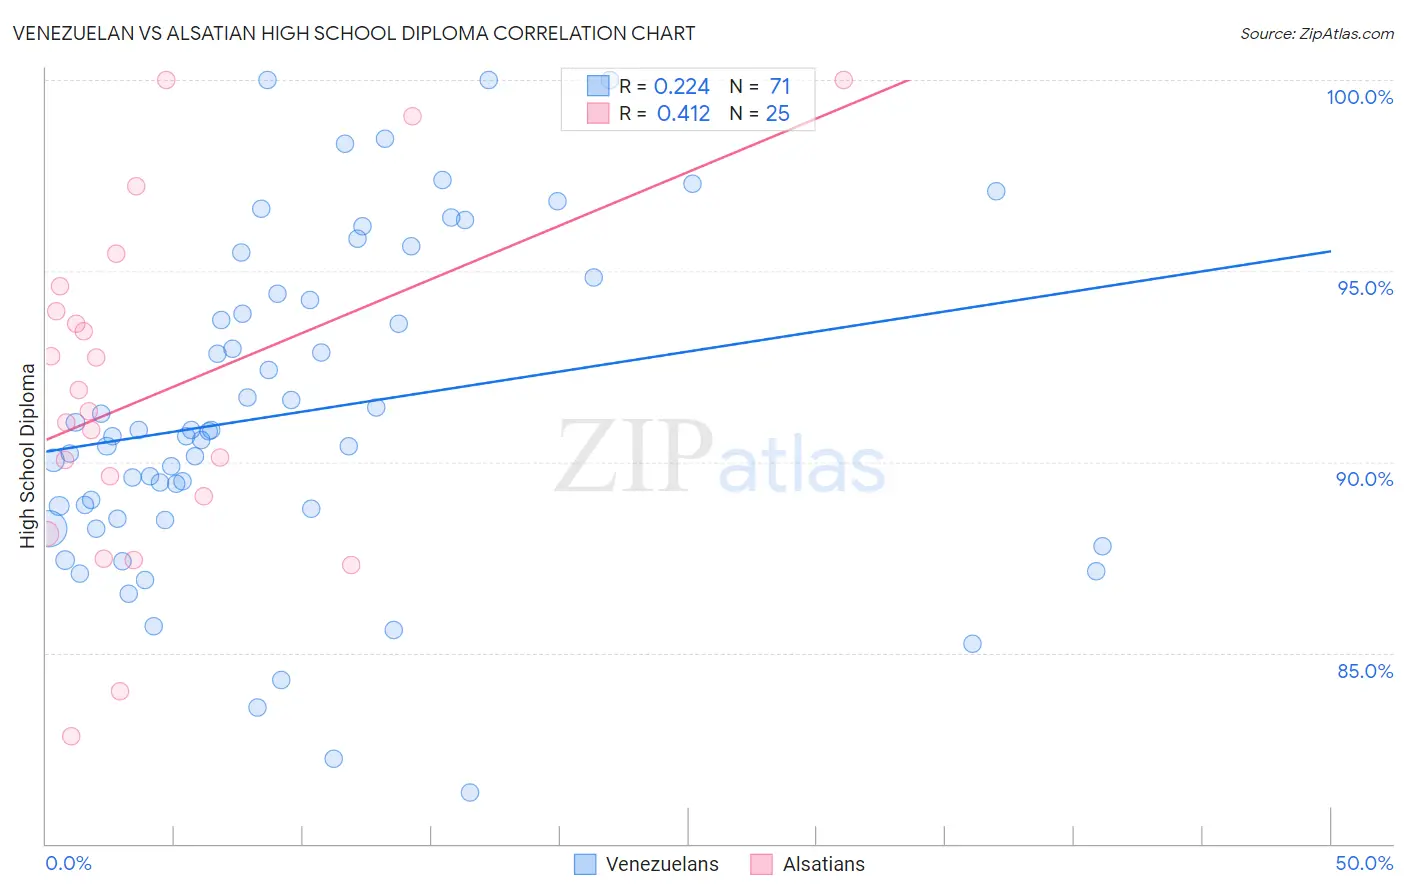
Venezuelan vs Alsatian High School Diploma Correlation Chart
The statistical analysis conducted on geographies consisting of 306,323,638 people shows a weak positive correlation between the proportion of Venezuelans and percentage of population with at least high school diploma education in the United States with a correlation coefficient (R) of 0.224 and weighted average of 89.1%. Similarly, the statistical analysis conducted on geographies consisting of 82,682,365 people shows a moderate positive correlation between the proportion of Alsatians and percentage of population with at least high school diploma education in the United States with a correlation coefficient (R) of 0.412 and weighted average of 89.4%, a difference of 0.36%.
High School Diploma Correlation Summary
| Measurement | Venezuelan | Alsatian |
| Minimum | 81.3% | 82.8% |
| Maximum | 100.0% | 100.0% |
| Range | 18.7% | 17.2% |
| Mean | 91.3% | 91.8% |
| Median | 90.7% | 91.3% |
| Interquartile 25% (IQ1) | 88.5% | 88.6% |
| Interquartile 75% (IQ3) | 94.4% | 94.3% |
| Interquartile Range (IQR) | 5.9% | 5.7% |
| Standard Deviation (Sample) | 4.3% | 4.5% |
| Standard Deviation (Population) | 4.2% | 4.4% |
Similar Demographics by High School Diploma
Demographics Similar to Venezuelans by High School Diploma
In terms of high school diploma, the demographic groups most similar to Venezuelans are Spaniard (89.1%, a difference of 0.0%), Bolivian (89.1%, a difference of 0.020%), Potawatomi (89.0%, a difference of 0.020%), American (89.1%, a difference of 0.050%), and Sudanese (89.1%, a difference of 0.070%).
| Demographics | Rating | Rank | High School Diploma |
| Hmong | 50.0 /100 | #174 | Average 89.1% |
| Immigrants | Western Asia | 49.0 /100 | #175 | Average 89.1% |
| Osage | 48.9 /100 | #176 | Average 89.1% |
| Sudanese | 48.5 /100 | #177 | Average 89.1% |
| Sierra Leoneans | 48.4 /100 | #178 | Average 89.1% |
| Americans | 47.2 /100 | #179 | Average 89.1% |
| Bolivians | 45.2 /100 | #180 | Average 89.1% |
| Venezuelans | 43.6 /100 | #181 | Average 89.1% |
| Spaniards | 43.4 /100 | #182 | Average 89.1% |
| Potawatomi | 42.5 /100 | #183 | Average 89.0% |
| Immigrants | Syria | 39.2 /100 | #184 | Fair 89.0% |
| Ethiopians | 37.0 /100 | #185 | Fair 89.0% |
| Immigrants | Eastern Africa | 35.8 /100 | #186 | Fair 88.9% |
| Guamanians/Chamorros | 35.5 /100 | #187 | Fair 88.9% |
| Immigrants | Sudan | 33.4 /100 | #188 | Fair 88.9% |
Demographics Similar to Alsatians by High School Diploma
In terms of high school diploma, the demographic groups most similar to Alsatians are Immigrants from Northern Africa (89.4%, a difference of 0.010%), Immigrants from Argentina (89.4%, a difference of 0.020%), Immigrants from Iraq (89.4%, a difference of 0.030%), Immigrants from Malaysia (89.3%, a difference of 0.050%), and Asian (89.4%, a difference of 0.070%).
| Demographics | Rating | Rank | High School Diploma |
| Iraqis | 73.9 /100 | #147 | Good 89.5% |
| Immigrants | Lebanon | 73.4 /100 | #148 | Good 89.5% |
| Immigrants | Poland | 72.9 /100 | #149 | Good 89.5% |
| Argentineans | 72.3 /100 | #150 | Good 89.5% |
| Paraguayans | 71.4 /100 | #151 | Good 89.5% |
| Asians | 70.7 /100 | #152 | Good 89.4% |
| Immigrants | Iraq | 68.7 /100 | #153 | Good 89.4% |
| Alsatians | 66.8 /100 | #154 | Good 89.4% |
| Immigrants | Northern Africa | 66.4 /100 | #155 | Good 89.4% |
| Immigrants | Argentina | 65.5 /100 | #156 | Good 89.4% |
| Immigrants | Malaysia | 63.5 /100 | #157 | Good 89.3% |
| Immigrants | Pakistan | 62.5 /100 | #158 | Good 89.3% |
| Immigrants | China | 62.0 /100 | #159 | Good 89.3% |
| Laotians | 61.8 /100 | #160 | Good 89.3% |
| Brazilians | 61.2 /100 | #161 | Good 89.3% |