Ute vs Immigrants from Serbia No Schooling Completed
COMPARE
Ute
Immigrants from Serbia
No Schooling Completed
No Schooling Completed Comparison
Ute
Immigrants from Serbia
2.3%
NO SCHOOLING COMPLETED
8.2/ 100
METRIC RATING
213th/ 347
METRIC RANK
1.9%
NO SCHOOLING COMPLETED
95.8/ 100
METRIC RATING
117th/ 347
METRIC RANK
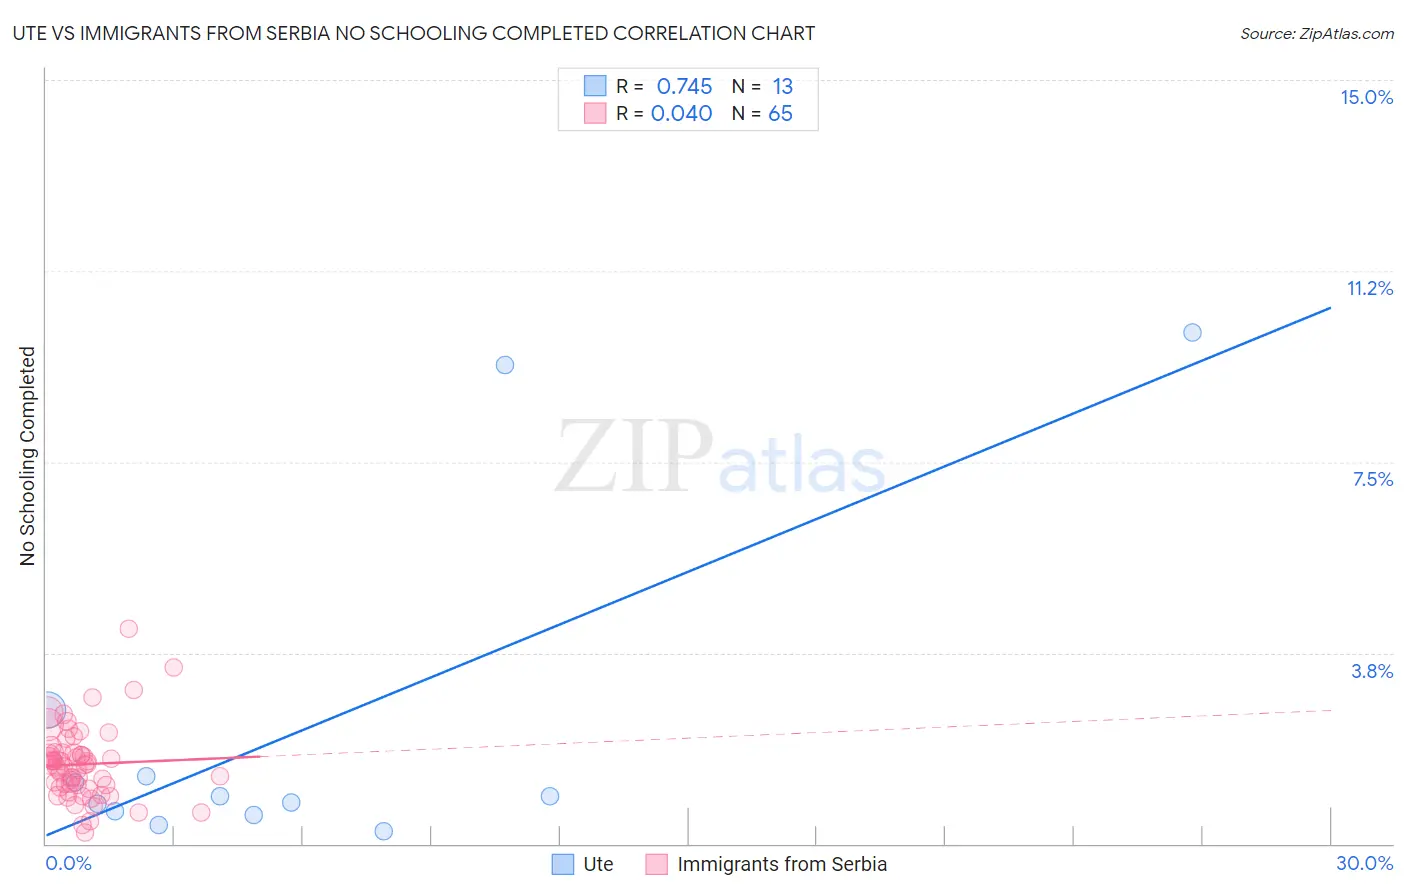
Ute vs Immigrants from Serbia No Schooling Completed Correlation Chart
The statistical analysis conducted on geographies consisting of 55,448,088 people shows a strong positive correlation between the proportion of Ute and percentage of population with no schooling in the United States with a correlation coefficient (R) of 0.745 and weighted average of 2.3%. Similarly, the statistical analysis conducted on geographies consisting of 131,329,769 people shows no correlation between the proportion of Immigrants from Serbia and percentage of population with no schooling in the United States with a correlation coefficient (R) of 0.040 and weighted average of 1.9%, a difference of 20.8%.
No Schooling Completed Correlation Summary
| Measurement | Ute | Immigrants from Serbia |
| Minimum | 0.24% | 0.22% |
| Maximum | 10.1% | 4.2% |
| Range | 9.8% | 4.0% |
| Mean | 2.3% | 1.6% |
| Median | 0.92% | 1.5% |
| Interquartile 25% (IQ1) | 0.61% | 1.1% |
| Interquartile 75% (IQ3) | 2.0% | 1.8% |
| Interquartile Range (IQR) | 1.4% | 0.66% |
| Standard Deviation (Sample) | 3.4% | 0.71% |
| Standard Deviation (Population) | 3.2% | 0.70% |
Similar Demographics by No Schooling Completed
Demographics Similar to Ute by No Schooling Completed
In terms of no schooling completed, the demographic groups most similar to Ute are Samoan (2.3%, a difference of 0.040%), Immigrants from Morocco (2.3%, a difference of 0.19%), Immigrants from Panama (2.3%, a difference of 0.20%), Immigrants from Zaire (2.3%, a difference of 0.47%), and Native/Alaskan (2.2%, a difference of 0.66%).
| Demographics | Rating | Rank | No Schooling Completed |
| Bahamians | 11.6 /100 | #206 | Poor 2.2% |
| South American Indians | 11.0 /100 | #207 | Poor 2.2% |
| Uruguayans | 11.0 /100 | #208 | Poor 2.2% |
| Immigrants | Oceania | 10.2 /100 | #209 | Poor 2.2% |
| Natives/Alaskans | 10.0 /100 | #210 | Tragic 2.2% |
| Immigrants | Panama | 8.8 /100 | #211 | Tragic 2.3% |
| Immigrants | Morocco | 8.7 /100 | #212 | Tragic 2.3% |
| Ute | 8.2 /100 | #213 | Tragic 2.3% |
| Samoans | 8.2 /100 | #214 | Tragic 2.3% |
| Immigrants | Zaire | 7.2 /100 | #215 | Tragic 2.3% |
| Tongans | 6.8 /100 | #216 | Tragic 2.3% |
| Immigrants | Syria | 6.6 /100 | #217 | Tragic 2.3% |
| Immigrants | Nepal | 6.4 /100 | #218 | Tragic 2.3% |
| Senegalese | 5.6 /100 | #219 | Tragic 2.3% |
| Immigrants | Costa Rica | 5.1 /100 | #220 | Tragic 2.3% |
Demographics Similar to Immigrants from Serbia by No Schooling Completed
In terms of no schooling completed, the demographic groups most similar to Immigrants from Serbia are Lebanese (1.9%, a difference of 0.20%), Syrian (1.9%, a difference of 0.22%), Spanish (1.9%, a difference of 0.24%), Immigrants from Norway (1.9%, a difference of 0.35%), and Immigrants from Zimbabwe (1.9%, a difference of 0.36%).
| Demographics | Rating | Rank | No Schooling Completed |
| Immigrants | Latvia | 96.7 /100 | #110 | Exceptional 1.9% |
| Immigrants | Japan | 96.6 /100 | #111 | Exceptional 1.9% |
| Pueblo | 96.4 /100 | #112 | Exceptional 1.9% |
| Immigrants | Zimbabwe | 96.2 /100 | #113 | Exceptional 1.9% |
| Immigrants | Norway | 96.1 /100 | #114 | Exceptional 1.9% |
| Syrians | 96.0 /100 | #115 | Exceptional 1.9% |
| Lebanese | 96.0 /100 | #116 | Exceptional 1.9% |
| Immigrants | Serbia | 95.8 /100 | #117 | Exceptional 1.9% |
| Spanish | 95.5 /100 | #118 | Exceptional 1.9% |
| Iroquois | 95.1 /100 | #119 | Exceptional 1.9% |
| Immigrants | Bulgaria | 94.6 /100 | #120 | Exceptional 1.9% |
| Immigrants | Croatia | 94.5 /100 | #121 | Exceptional 1.9% |
| Cree | 94.5 /100 | #122 | Exceptional 1.9% |
| Immigrants | Kuwait | 93.9 /100 | #123 | Exceptional 1.9% |
| Cambodians | 93.8 /100 | #124 | Exceptional 1.9% |