Uruguayan vs Immigrants from Southern Europe 10th Grade

COMPARE

Uruguayan
Race
Ancestry
AfghanAfricanAlaska NativeAlaskan AthabascanAlbanianAleutAlsatianAmericanApacheArabArapahoArgentineanArmenianAssyrian/Chaldean/SyriacAustralianAustrianBahamianBangladeshiBarbadianBasqueBelgianBelizeanBermudanBhutaneseBlackfeetBolivianBrazilianBritishBritish West IndianBulgarianBurmeseCajunCambodianCanadianCape VerdeanCarpatho RusynCelticCentral AmericanCentral American IndianCherokeeCheyenneChickasawChileanChineseChippewaChoctawColombianColvilleComancheCosta RicanCreeCreekCroatianCrowCubanCypriotCzechCzechoslovakianDanishDelawareDominicanDutchDutch West IndianEastern EuropeanEcuadorianEgyptianEnglishEstonianEthiopianEuropeanFijianFilipinoFinnishFrenchFrench American IndianFrench CanadianGermanGerman RussianGhanaianGreekGuamanian/ChamorroGuatemalanGuyaneseHaitianHmongHonduranHopiHoumaHungarianIcelanderIndian (Asian)IndonesianInupiatIranianIraqiIrishIroquoisIsraeliItalianJamaicanJapaneseJordanianKenyanKiowaKoreanLaotianLatvianLebaneseLiberianLithuanianLumbeeLuxembourgerMacedonianMalaysianMalteseMarshalleseMenomineeMexicanMexican American IndianMongolianMoroccanNative HawaiianNavajoNepaleseNew ZealanderNicaraguanNigerianNorthern EuropeanNorwegianOkinawanOsageOttawaPaiutePakistaniPalestinianPanamanianParaguayanPennsylvania GermanPeruvianPimaPolishPortuguesePotawatomiPuebloPuerto RicanPuget Sound SalishRomanianRussianSalvadoranSamoanScandinavianScotch-IrishScottishSeminoleSenegaleseSerbianShoshoneSierra LeoneanSiouxSlavicSlovakSloveneSomaliSouth AfricanSouth AmericanSouth American IndianSoviet UnionSpaniardSpanishSpanish AmericanSpanish American IndianSri LankanSubsaharan AfricanSudaneseSwedishSwissSyrianTaiwaneseThaiTlingit-HaidaTohono O'OdhamTonganTrinidadian and TobagonianTsimshianTurkishU.S. Virgin IslanderUgandanUkrainianUruguayanUteVenezuelanVietnameseWelshWest IndianYakamaYaquiYugoslavianYumanYup'ikZimbabwean
Immigration
NonimmigrantsImmigrantsAfghanistanAfricaAlbaniaArgentinaArmeniaAsiaAustraliaAustriaBahamasBangladeshBarbadosBelarusBelgiumBelizeBoliviaBosnia and HerzegovinaBrazilBulgariaBurma/MyanmarCabo VerdeCambodiaCameroonCanadaCaribbeanCentral AmericaChileChinaColombiaCongoCosta RicaCroatiaCubaCzechoslovakiaDenmarkDominicaDominican RepublicEastern AfricaEastern AsiaEastern EuropeEcuadorEgyptEl SalvadorEnglandEritreaEthiopiaEuropeFijiFranceGermanyGhanaGreeceGrenadaGuatemalaGuyanaHaitiHondurasHong KongHungaryIndiaIndonesiaIranIraqIrelandIsraelItalyJamaicaJapanJordanKazakhstanKenyaKoreaKuwaitLaosLatin AmericaLatviaLebanonLiberiaLithuaniaMalaysiaMexicoMicronesiaMiddle AfricaMoldovaMoroccoNepalNetherlandsNicaraguaNigeriaNorth AmericaNorth MacedoniaNorthern AfricaNorthern EuropeNorwayOceaniaPakistanPanamaPeruPhilippinesPolandPortugalRomaniaRussiaSaudi ArabiaScotlandSenegalSerbiaSierra LeoneSingaporeSomaliaSouth AfricaSouth AmericaSouth Central AsiaSouth Eastern AsiaSpainSri LankaSt. Vincent and the GrenadinesSudanSwedenSwitzerlandSyriaTaiwanThailandTrinidad and TobagoTurkeyUgandaUkraineUruguayUzbekistanVenezuelaVietnamWest IndiesWestern AfricaWestern AsiaWestern EuropeYemenZaireZimbabweAzores
Immigrants from Southern Europe
Race
Ancestry
AfghanAfricanAlaska NativeAlaskan AthabascanAlbanianAleutAlsatianAmericanApacheArabArapahoArgentineanArmenianAssyrian/Chaldean/SyriacAustralianAustrianBahamianBangladeshiBarbadianBasqueBelgianBelizeanBermudanBhutaneseBlackfeetBolivianBrazilianBritishBritish West IndianBulgarianBurmeseCajunCambodianCanadianCape VerdeanCarpatho RusynCelticCentral AmericanCentral American IndianCherokeeCheyenneChickasawChileanChineseChippewaChoctawColombianColvilleComancheCosta RicanCreeCreekCroatianCrowCubanCypriotCzechCzechoslovakianDanishDelawareDominicanDutchDutch West IndianEastern EuropeanEcuadorianEgyptianEnglishEstonianEthiopianEuropeanFijianFilipinoFinnishFrenchFrench American IndianFrench CanadianGermanGerman RussianGhanaianGreekGuamanian/ChamorroGuatemalanGuyaneseHaitianHmongHonduranHopiHoumaHungarianIcelanderIndian (Asian)IndonesianInupiatIranianIraqiIrishIroquoisIsraeliItalianJamaicanJapaneseJordanianKenyanKiowaKoreanLaotianLatvianLebaneseLiberianLithuanianLumbeeLuxembourgerMacedonianMalaysianMalteseMarshalleseMenomineeMexicanMexican American IndianMongolianMoroccanNative HawaiianNavajoNepaleseNew ZealanderNicaraguanNigerianNorthern EuropeanNorwegianOkinawanOsageOttawaPaiutePakistaniPalestinianPanamanianParaguayanPennsylvania GermanPeruvianPimaPolishPortuguesePotawatomiPuebloPuerto RicanPuget Sound SalishRomanianRussianSalvadoranSamoanScandinavianScotch-IrishScottishSeminoleSenegaleseSerbianShoshoneSierra LeoneanSiouxSlavicSlovakSloveneSomaliSouth AfricanSouth AmericanSouth American IndianSoviet UnionSpaniardSpanishSpanish AmericanSpanish American IndianSri LankanSubsaharan AfricanSudaneseSwedishSwissSyrianTaiwaneseThaiTlingit-HaidaTohono O'OdhamTonganTrinidadian and TobagonianTsimshianTurkishU.S. Virgin IslanderUgandanUkrainianUteVenezuelanVietnameseWelshWest IndianYakamaYaquiYugoslavianYumanYup'ikZimbabwean
Immigration
NonimmigrantsImmigrantsAfghanistanAfricaAlbaniaArgentinaArmeniaAsiaAustraliaAustriaBahamasBangladeshBarbadosBelarusBelgiumBelizeBoliviaBosnia and HerzegovinaBrazilBulgariaBurma/MyanmarCabo VerdeCambodiaCameroonCanadaCaribbeanCentral AmericaChileChinaColombiaCongoCosta RicaCroatiaCubaCzechoslovakiaDenmarkDominicaDominican RepublicEastern AfricaEastern AsiaEastern EuropeEcuadorEgyptEl SalvadorEnglandEritreaEthiopiaEuropeFijiFranceGermanyGhanaGreeceGrenadaGuatemalaGuyanaHaitiHondurasHong KongHungaryIndiaIndonesiaIranIraqIrelandIsraelItalyJamaicaJapanJordanKazakhstanKenyaKoreaKuwaitLaosLatin AmericaLatviaLebanonLiberiaLithuaniaMalaysiaMexicoMicronesiaMiddle AfricaMoldovaMoroccoNepalNetherlandsNicaraguaNigeriaNorth AmericaNorth MacedoniaNorthern AfricaNorthern EuropeNorwayOceaniaPakistanPanamaPeruPhilippinesPolandPortugalRomaniaRussiaSaudi ArabiaScotlandSenegalSerbiaSierra LeoneSingaporeSomaliaSouth AfricaSouth AmericaSouth Central AsiaSouth Eastern AsiaSouthern EuropeSpainSri LankaSt. Vincent and the GrenadinesSudanSwedenSwitzerlandSyriaTaiwanThailandTrinidad and TobagoTurkeyUgandaUkraineUruguayUzbekistanVenezuelaVietnamWest IndiesWestern AfricaWestern AsiaWestern EuropeYemenZaireZimbabweAzores
10th Grade
Income
Poverty
Unemployment
Labor Participation
Family Structure
Vehicle Availability
Education Level
Disability

10th Grade Comparison

Uruguayans

Immigrants from Southern Europe

Tragic
Tragic
92.9%
10TH GRADE
1.8/ 100
METRIC RATING
245th/ 347
METRIC RANK
93.2%
10TH GRADE
8.9/ 100
METRIC RATING
221st/ 347
METRIC RANK

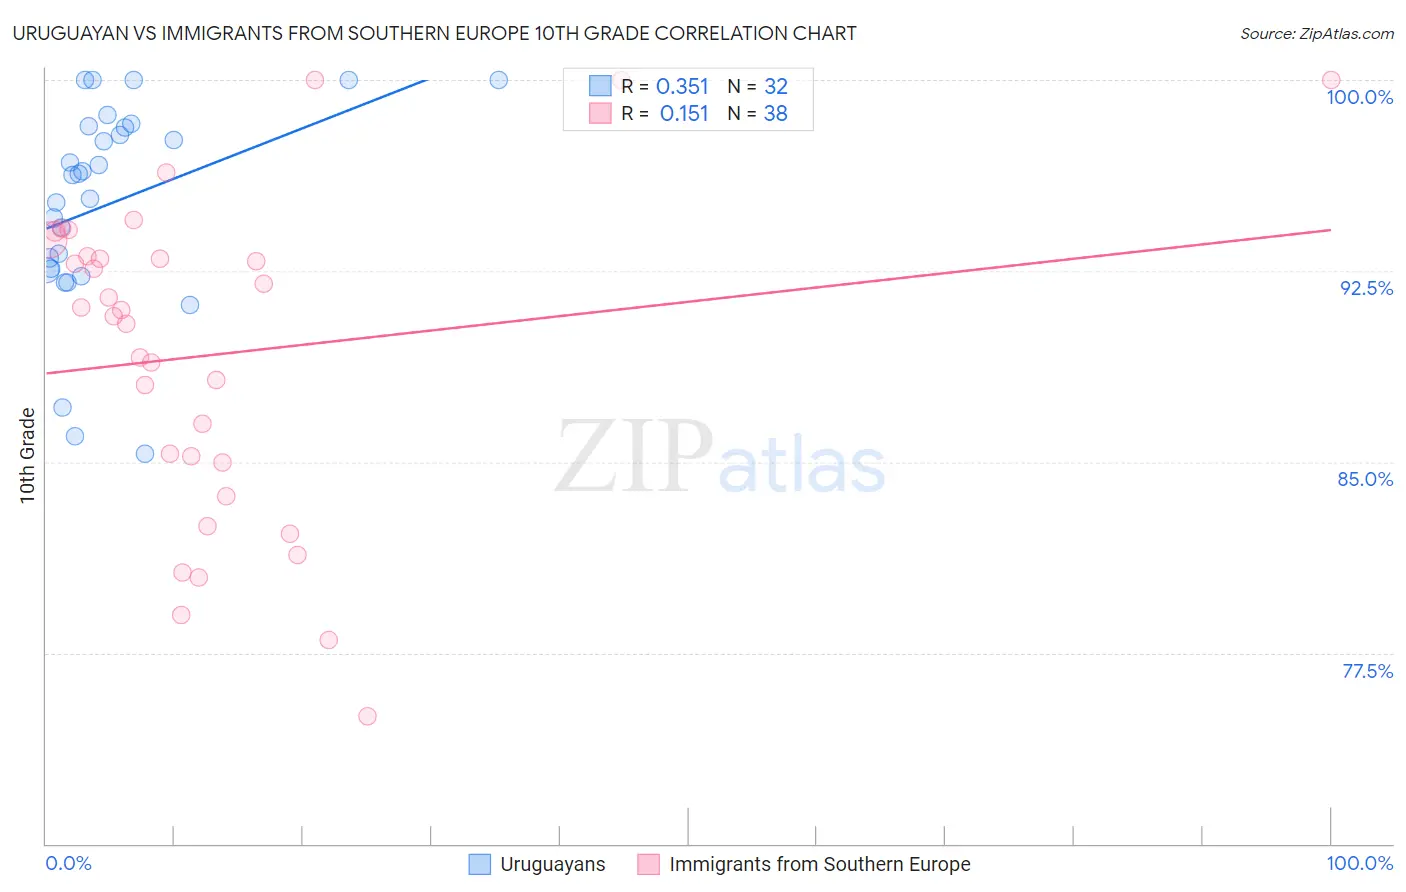
Uruguayan vs Immigrants from Southern Europe 10th Grade Correlation Chart

The statistical analysis conducted on geographies consisting of 144,782,794 people shows a mild positive correlation between the proportion of Uruguayans and percentage of population with at least 10th grade education in the United States with a correlation coefficient (R) of 0.351 and weighted average of 92.9%. Similarly, the statistical analysis conducted on geographies consisting of 402,804,595 people shows a poor positive correlation between the proportion of Immigrants from Southern Europe and percentage of population with at least 10th grade education in the United States with a correlation coefficient (R) of 0.151 and weighted average of 93.2%, a difference of 0.37%.
Uruguayan vs Immigrants from Southern Europe 10th Grade

10th Grade Correlation Summary

MeasurementUruguayanImmigrants from Southern Europe
Minimum85.3%75.0%
Maximum100.0%100.0%
Range14.7%25.0%
Mean95.2%89.2%
Median96.3%90.8%
Interquartile 25% (IQ1)92.6%85.0%
Interquartile 75% (IQ3)98.1%93.1%
Interquartile Range (IQR)5.6%8.1%
Standard Deviation (Sample)4.0%6.3%
Standard Deviation (Population)3.9%6.2%

Similar Demographics by 10th Grade

Demographics Similar to Uruguayans by 10th Grade

In terms of 10th grade, the demographic groups most similar to Uruguayans are Immigrants from Middle Africa (92.9%, a difference of 0.020%), Spanish American (92.9%, a difference of 0.030%), Senegalese (93.0%, a difference of 0.060%), Immigrants from Afghanistan (92.8%, a difference of 0.060%), and Colombian (92.8%, a difference of 0.070%).
DemographicsRating | Rank10th Grade
Nigerians
4.2
/100
|
#238
Tragic
93.1%
Costa Ricans
4.2
/100
|
#239
Tragic
93.1%
Immigrants | Hong Kong
4.2
/100
|
#240
Tragic
93.1%
Immigrants | Somalia
2.7
/100
|
#241
Tragic
93.0%
Immigrants | Cameroon
2.6
/100
|
#242
Tragic
93.0%
Senegalese
2.4
/100
|
#243
Tragic
93.0%
Spanish Americans
2.1
/100
|
#244
Tragic
92.9%
Uruguayans
1.8
/100
|
#245
Tragic
92.9%
Immigrants | Middle Africa
1.7
/100
|
#246
Tragic
92.9%
Immigrants | Afghanistan
1.4
/100
|
#247
Tragic
92.8%
Colombians
1.4
/100
|
#248
Tragic
92.8%
Immigrants | Senegal
1.4
/100
|
#249
Tragic
92.8%
Jamaicans
1.2
/100
|
#250
Tragic
92.8%
Immigrants | Thailand
1.0
/100
|
#251
Tragic
92.8%
South Americans
0.9
/100
|
#252
Tragic
92.8%

Demographics Similar to Immigrants from Southern Europe by 10th Grade

In terms of 10th grade, the demographic groups most similar to Immigrants from Southern Europe are Tongan (93.3%, a difference of 0.020%), Ethiopian (93.2%, a difference of 0.030%), Immigrants from Liberia (93.3%, a difference of 0.040%), Seminole (93.3%, a difference of 0.040%), and Immigrants from Sierra Leone (93.2%, a difference of 0.040%).
DemographicsRating | Rank10th Grade
Immigrants | Bahamas
15.2
/100
|
#214
Poor
93.4%
Immigrants | Oceania
15.1
/100
|
#215
Poor
93.4%
Immigrants | Eastern Africa
14.7
/100
|
#216
Poor
93.4%
Portuguese
12.1
/100
|
#217
Poor
93.3%
Immigrants | Liberia
10.2
/100
|
#218
Poor
93.3%
Seminole
10.2
/100
|
#219
Poor
93.3%
Tongans
9.5
/100
|
#220
Tragic
93.3%
Immigrants | Southern Europe
8.9
/100
|
#221
Tragic
93.2%
Ethiopians
7.9
/100
|
#222
Tragic
93.2%
Immigrants | Sierra Leone
7.6
/100
|
#223
Tragic
93.2%
Bolivians
6.7
/100
|
#224
Tragic
93.2%
Somalis
6.2
/100
|
#225
Tragic
93.2%
Koreans
6.1
/100
|
#226
Tragic
93.2%
Blacks/African Americans
6.0
/100
|
#227
Tragic
93.2%
Immigrants | China
5.9
/100
|
#228
Tragic
93.2%