Uruguayan vs Hmong Associate's Degree
COMPARE
Uruguayan
Hmong
Associate's Degree
Associate's Degree Comparison
Uruguayans
Hmong
46.5%
ASSOCIATE'S DEGREE
55.4/ 100
METRIC RATING
169th/ 347
METRIC RANK
43.4%
ASSOCIATE'S DEGREE
3.2/ 100
METRIC RATING
228th/ 347
METRIC RANK
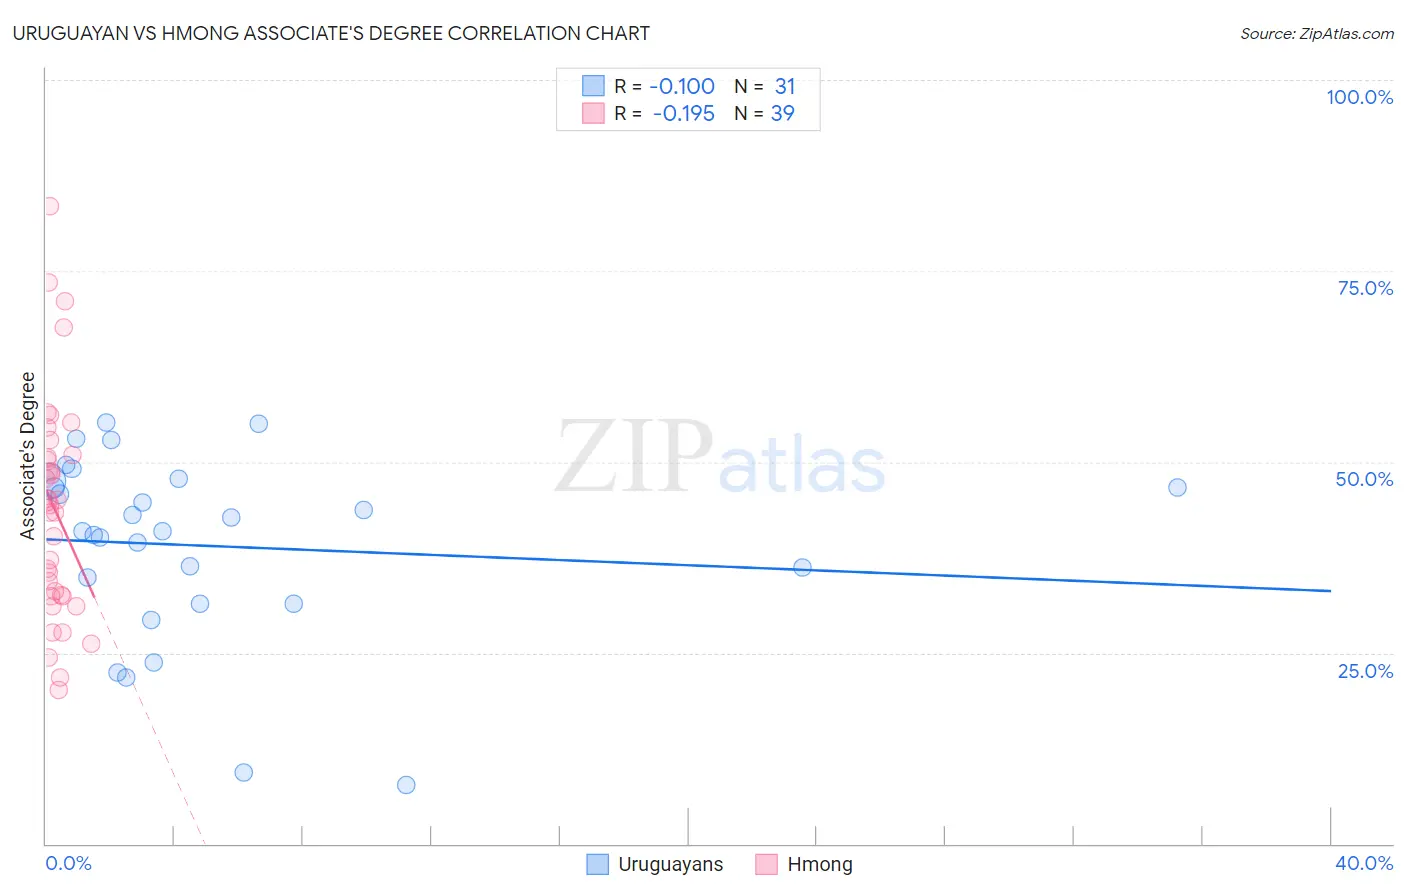
Uruguayan vs Hmong Associate's Degree Correlation Chart
The statistical analysis conducted on geographies consisting of 144,782,470 people shows a poor negative correlation between the proportion of Uruguayans and percentage of population with at least associate's degree education in the United States with a correlation coefficient (R) of -0.100 and weighted average of 46.5%. Similarly, the statistical analysis conducted on geographies consisting of 24,680,511 people shows a poor negative correlation between the proportion of Hmong and percentage of population with at least associate's degree education in the United States with a correlation coefficient (R) of -0.195 and weighted average of 43.4%, a difference of 7.2%.
Associate's Degree Correlation Summary
| Measurement | Uruguayan | Hmong |
| Minimum | 7.6% | 20.2% |
| Maximum | 55.1% | 83.4% |
| Range | 47.5% | 63.2% |
| Mean | 39.0% | 43.7% |
| Median | 40.9% | 44.4% |
| Interquartile 25% (IQ1) | 31.4% | 32.4% |
| Interquartile 75% (IQ3) | 47.4% | 50.9% |
| Interquartile Range (IQR) | 16.1% | 18.6% |
| Standard Deviation (Sample) | 12.2% | 14.5% |
| Standard Deviation (Population) | 12.0% | 14.3% |
Similar Demographics by Associate's Degree
Demographics Similar to Uruguayans by Associate's Degree
In terms of associate's degree, the demographic groups most similar to Uruguayans are Immigrants from Somalia (46.5%, a difference of 0.010%), Irish (46.5%, a difference of 0.13%), Basque (46.5%, a difference of 0.19%), Immigrants from Sierra Leone (46.7%, a difference of 0.29%), and Hungarian (46.7%, a difference of 0.30%).
| Demographics | Rating | Rank | Associate's Degree |
| Immigrants | Africa | 63.2 /100 | #162 | Good 46.8% |
| Somalis | 62.5 /100 | #163 | Good 46.8% |
| Colombians | 62.4 /100 | #164 | Good 46.8% |
| Immigrants | South America | 59.9 /100 | #165 | Average 46.7% |
| Hungarians | 59.3 /100 | #166 | Average 46.7% |
| Immigrants | Sierra Leone | 59.2 /100 | #167 | Average 46.7% |
| Immigrants | Somalia | 55.5 /100 | #168 | Average 46.5% |
| Uruguayans | 55.4 /100 | #169 | Average 46.5% |
| Irish | 53.6 /100 | #170 | Average 46.5% |
| Basques | 52.8 /100 | #171 | Average 46.5% |
| Peruvians | 50.5 /100 | #172 | Average 46.4% |
| Immigrants | Iraq | 50.3 /100 | #173 | Average 46.4% |
| English | 50.0 /100 | #174 | Average 46.4% |
| Belgians | 48.9 /100 | #175 | Average 46.3% |
| Finns | 48.5 /100 | #176 | Average 46.3% |
Demographics Similar to Hmong by Associate's Degree
In terms of associate's degree, the demographic groups most similar to Hmong are Immigrants from Trinidad and Tobago (43.3%, a difference of 0.16%), Immigrants from Barbados (43.3%, a difference of 0.23%), Liberian (43.3%, a difference of 0.23%), Trinidadian and Tobagonian (43.6%, a difference of 0.44%), and Immigrants from Burma/Myanmar (43.7%, a difference of 0.62%).
| Demographics | Rating | Rank | Associate's Degree |
| Immigrants | Western Africa | 6.6 /100 | #221 | Tragic 44.1% |
| Barbadians | 5.8 /100 | #222 | Tragic 43.9% |
| Sub-Saharan Africans | 5.5 /100 | #223 | Tragic 43.9% |
| West Indians | 5.2 /100 | #224 | Tragic 43.8% |
| Guamanians/Chamorros | 4.8 /100 | #225 | Tragic 43.8% |
| Immigrants | Burma/Myanmar | 4.3 /100 | #226 | Tragic 43.7% |
| Trinidadians and Tobagonians | 4.0 /100 | #227 | Tragic 43.6% |
| Hmong | 3.2 /100 | #228 | Tragic 43.4% |
| Immigrants | Trinidad and Tobago | 3.0 /100 | #229 | Tragic 43.3% |
| Immigrants | Barbados | 2.9 /100 | #230 | Tragic 43.3% |
| Liberians | 2.9 /100 | #231 | Tragic 43.3% |
| Native Hawaiians | 2.3 /100 | #232 | Tragic 43.1% |
| Tongans | 2.2 /100 | #233 | Tragic 43.0% |
| Tlingit-Haida | 2.1 /100 | #234 | Tragic 43.0% |
| Ecuadorians | 2.0 /100 | #235 | Tragic 43.0% |