Ukrainian vs Immigrants from Nepal 8th Grade

COMPARE

Ukrainian
Race
Ancestry
AfghanAfricanAlaska NativeAlaskan AthabascanAlbanianAleutAlsatianAmericanApacheArabArapahoArgentineanArmenianAssyrian/Chaldean/SyriacAustralianAustrianBahamianBangladeshiBarbadianBasqueBelgianBelizeanBermudanBhutaneseBlackfeetBolivianBrazilianBritishBritish West IndianBulgarianBurmeseCajunCambodianCanadianCape VerdeanCarpatho RusynCelticCentral AmericanCentral American IndianCherokeeCheyenneChickasawChileanChineseChippewaChoctawColombianColvilleComancheCosta RicanCreeCreekCroatianCrowCubanCypriotCzechCzechoslovakianDanishDelawareDominicanDutchDutch West IndianEastern EuropeanEcuadorianEgyptianEnglishEstonianEthiopianEuropeanFijianFilipinoFinnishFrenchFrench American IndianFrench CanadianGermanGerman RussianGhanaianGreekGuamanian/ChamorroGuatemalanGuyaneseHaitianHmongHonduranHopiHoumaHungarianIcelanderIndian (Asian)IndonesianInupiatIranianIraqiIrishIroquoisIsraeliItalianJamaicanJapaneseJordanianKenyanKiowaKoreanLaotianLatvianLebaneseLiberianLithuanianLumbeeLuxembourgerMacedonianMalaysianMalteseMarshalleseMenomineeMexicanMexican American IndianMongolianMoroccanNative HawaiianNavajoNepaleseNew ZealanderNicaraguanNigerianNorthern EuropeanNorwegianOkinawanOsageOttawaPaiutePakistaniPalestinianPanamanianParaguayanPennsylvania GermanPeruvianPimaPolishPortuguesePotawatomiPuebloPuerto RicanPuget Sound SalishRomanianRussianSalvadoranSamoanScandinavianScotch-IrishScottishSeminoleSenegaleseSerbianShoshoneSierra LeoneanSiouxSlavicSlovakSloveneSomaliSouth AfricanSouth AmericanSouth American IndianSoviet UnionSpaniardSpanishSpanish AmericanSpanish American IndianSri LankanSubsaharan AfricanSudaneseSwedishSwissSyrianTaiwaneseThaiTlingit-HaidaTohono O'OdhamTonganTrinidadian and TobagonianTsimshianTurkishU.S. Virgin IslanderUgandanUkrainianUruguayanUteVenezuelanVietnameseWelshWest IndianYakamaYaquiYugoslavianYumanYup'ikZimbabwean
Immigration
NonimmigrantsImmigrantsAfghanistanAfricaAlbaniaArgentinaArmeniaAsiaAustraliaAustriaBahamasBangladeshBarbadosBelarusBelgiumBelizeBoliviaBosnia and HerzegovinaBrazilBulgariaBurma/MyanmarCabo VerdeCambodiaCameroonCanadaCaribbeanCentral AmericaChileChinaColombiaCongoCosta RicaCroatiaCubaCzechoslovakiaDenmarkDominicaDominican RepublicEastern AfricaEastern AsiaEastern EuropeEcuadorEgyptEl SalvadorEnglandEritreaEthiopiaEuropeFijiFranceGermanyGhanaGreeceGrenadaGuatemalaGuyanaHaitiHondurasHong KongHungaryIndiaIndonesiaIranIraqIrelandIsraelItalyJamaicaJapanJordanKazakhstanKenyaKoreaKuwaitLaosLatin AmericaLatviaLebanonLiberiaLithuaniaMalaysiaMexicoMicronesiaMiddle AfricaMoldovaMoroccoNetherlandsNicaraguaNigeriaNorth AmericaNorth MacedoniaNorthern AfricaNorthern EuropeNorwayOceaniaPakistanPanamaPeruPhilippinesPolandPortugalRomaniaRussiaSaudi ArabiaScotlandSenegalSerbiaSierra LeoneSingaporeSomaliaSouth AfricaSouth AmericaSouth Central AsiaSouth Eastern AsiaSouthern EuropeSpainSri LankaSt. Vincent and the GrenadinesSudanSwedenSwitzerlandSyriaTaiwanThailandTrinidad and TobagoTurkeyUgandaUkraineUruguayUzbekistanVenezuelaVietnamWest IndiesWestern AfricaWestern AsiaWestern EuropeYemenZaireZimbabweAzores
Immigrants from Nepal
Race
Ancestry
AfghanAfricanAlaska NativeAlaskan AthabascanAlbanianAleutAlsatianAmericanApacheArabArapahoArgentineanArmenianAssyrian/Chaldean/SyriacAustralianAustrianBahamianBangladeshiBarbadianBasqueBelgianBelizeanBermudanBhutaneseBlackfeetBolivianBrazilianBritishBritish West IndianBulgarianBurmeseCajunCambodianCanadianCape VerdeanCarpatho RusynCelticCentral AmericanCentral American IndianCherokeeCheyenneChickasawChileanChineseChippewaChoctawColombianColvilleComancheCosta RicanCreeCreekCroatianCrowCubanCypriotCzechCzechoslovakianDanishDelawareDominicanDutchDutch West IndianEastern EuropeanEcuadorianEgyptianEnglishEstonianEthiopianEuropeanFijianFilipinoFinnishFrenchFrench American IndianFrench CanadianGermanGerman RussianGhanaianGreekGuamanian/ChamorroGuatemalanGuyaneseHaitianHmongHonduranHopiHoumaHungarianIcelanderIndian (Asian)IndonesianInupiatIranianIraqiIrishIroquoisIsraeliItalianJamaicanJapaneseJordanianKenyanKiowaKoreanLaotianLatvianLebaneseLiberianLithuanianLumbeeLuxembourgerMacedonianMalaysianMalteseMarshalleseMenomineeMexicanMexican American IndianMongolianMoroccanNative HawaiianNavajoNepaleseNew ZealanderNicaraguanNigerianNorthern EuropeanNorwegianOkinawanOsageOttawaPaiutePakistaniPalestinianPanamanianParaguayanPennsylvania GermanPeruvianPimaPolishPortuguesePotawatomiPuebloPuerto RicanPuget Sound SalishRomanianRussianSalvadoranSamoanScandinavianScotch-IrishScottishSeminoleSenegaleseSerbianShoshoneSierra LeoneanSiouxSlavicSlovakSloveneSomaliSouth AfricanSouth AmericanSouth American IndianSoviet UnionSpaniardSpanishSpanish AmericanSpanish American IndianSri LankanSubsaharan AfricanSudaneseSwedishSwissSyrianTaiwaneseThaiTlingit-HaidaTohono O'OdhamTonganTrinidadian and TobagonianTsimshianTurkishU.S. Virgin IslanderUgandanUruguayanUteVenezuelanVietnameseWelshWest IndianYakamaYaquiYugoslavianYumanYup'ikZimbabwean
Immigration
NonimmigrantsImmigrantsAfghanistanAfricaAlbaniaArgentinaArmeniaAsiaAustraliaAustriaBahamasBangladeshBarbadosBelarusBelgiumBelizeBoliviaBosnia and HerzegovinaBrazilBulgariaBurma/MyanmarCabo VerdeCambodiaCameroonCanadaCaribbeanCentral AmericaChileChinaColombiaCongoCosta RicaCroatiaCubaCzechoslovakiaDenmarkDominicaDominican RepublicEastern AfricaEastern AsiaEastern EuropeEcuadorEgyptEl SalvadorEnglandEritreaEthiopiaEuropeFijiFranceGermanyGhanaGreeceGrenadaGuatemalaGuyanaHaitiHondurasHong KongHungaryIndiaIndonesiaIranIraqIrelandIsraelItalyJamaicaJapanJordanKazakhstanKenyaKoreaKuwaitLaosLatin AmericaLatviaLebanonLiberiaLithuaniaMalaysiaMexicoMicronesiaMiddle AfricaMoldovaMoroccoNepalNetherlandsNicaraguaNigeriaNorth AmericaNorth MacedoniaNorthern AfricaNorthern EuropeNorwayOceaniaPakistanPanamaPeruPhilippinesPolandPortugalRomaniaRussiaSaudi ArabiaScotlandSenegalSerbiaSierra LeoneSingaporeSomaliaSouth AfricaSouth AmericaSouth Central AsiaSouth Eastern AsiaSouthern EuropeSpainSri LankaSt. Vincent and the GrenadinesSudanSwedenSwitzerlandSyriaTaiwanThailandTrinidad and TobagoTurkeyUgandaUkraineUruguayUzbekistanVenezuelaVietnamWest IndiesWestern AfricaWestern AsiaWestern EuropeYemenZaireZimbabweAzores
8th Grade
Income
Poverty
Unemployment
Labor Participation
Family Structure
Vehicle Availability
Education Level
Disability

8th Grade Comparison

Ukrainians

Immigrants from Nepal

Exceptional
Fair
96.7%
8TH GRADE
99.7/ 100
METRIC RATING
63rd/ 347
METRIC RANK
95.6%
8TH GRADE
30.2/ 100
METRIC RATING
191st/ 347
METRIC RANK

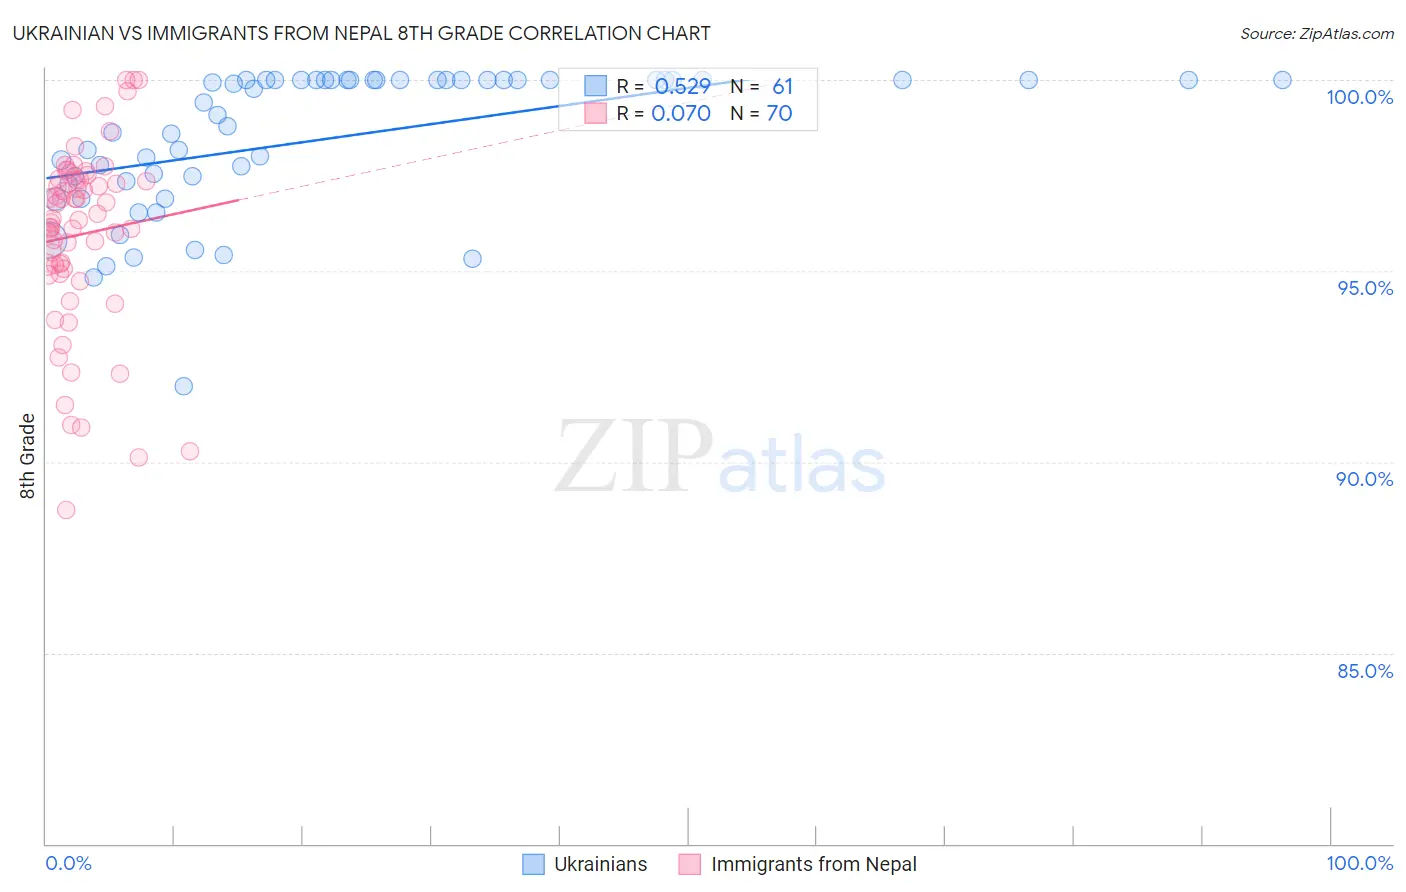
Ukrainian vs Immigrants from Nepal 8th Grade Correlation Chart

The statistical analysis conducted on geographies consisting of 448,697,146 people shows a substantial positive correlation between the proportion of Ukrainians and percentage of population with at least 8th grade education in the United States with a correlation coefficient (R) of 0.529 and weighted average of 96.7%. Similarly, the statistical analysis conducted on geographies consisting of 186,622,433 people shows a slight positive correlation between the proportion of Immigrants from Nepal and percentage of population with at least 8th grade education in the United States with a correlation coefficient (R) of 0.070 and weighted average of 95.6%, a difference of 1.1%.
Ukrainian vs Immigrants from Nepal 8th Grade

8th Grade Correlation Summary

MeasurementUkrainianImmigrants from Nepal
Minimum92.0%88.7%
Maximum100.0%100.0%
Range8.0%11.3%
Mean98.5%96.0%
Median99.4%96.4%
Interquartile 25% (IQ1)97.3%95.1%
Interquartile 75% (IQ3)100.0%97.4%
Interquartile Range (IQR)2.7%2.3%
Standard Deviation (Sample)1.9%2.4%
Standard Deviation (Population)1.9%2.4%

Similar Demographics by 8th Grade

Demographics Similar to Ukrainians by 8th Grade

In terms of 8th grade, the demographic groups most similar to Ukrainians are Immigrants from India (96.6%, a difference of 0.0%), Native Hawaiian (96.6%, a difference of 0.0%), Canadian (96.6%, a difference of 0.010%), Iranian (96.6%, a difference of 0.010%), and White/Caucasian (96.7%, a difference of 0.020%).
DemographicsRating | Rank8th Grade
Australians
99.8
/100
|
#56
Exceptional
96.7%
Macedonians
99.8
/100
|
#57
Exceptional
96.7%
Immigrants | Canada
99.8
/100
|
#58
Exceptional
96.7%
Immigrants | North America
99.8
/100
|
#59
Exceptional
96.7%
Immigrants | Northern Europe
99.8
/100
|
#60
Exceptional
96.7%
Immigrants | Austria
99.8
/100
|
#61
Exceptional
96.7%
Whites/Caucasians
99.8
/100
|
#62
Exceptional
96.7%
Ukrainians
99.7
/100
|
#63
Exceptional
96.7%
Immigrants | India
99.7
/100
|
#64
Exceptional
96.6%
Native Hawaiians
99.7
/100
|
#65
Exceptional
96.6%
Canadians
99.7
/100
|
#66
Exceptional
96.6%
Iranians
99.7
/100
|
#67
Exceptional
96.6%
Creek
99.7
/100
|
#68
Exceptional
96.6%
Americans
99.7
/100
|
#69
Exceptional
96.6%
Immigrants | Lithuania
99.6
/100
|
#70
Exceptional
96.6%

Demographics Similar to Immigrants from Nepal by 8th Grade

In terms of 8th grade, the demographic groups most similar to Immigrants from Nepal are Immigrants from Venezuela (95.6%, a difference of 0.0%), Immigrants from Micronesia (95.6%, a difference of 0.010%), Pima (95.6%, a difference of 0.010%), Panamanian (95.6%, a difference of 0.010%), and Sudanese (95.6%, a difference of 0.020%).
DemographicsRating | Rank8th Grade
Immigrants | Uganda
36.0
/100
|
#184
Fair
95.6%
Blacks/African Americans
34.8
/100
|
#185
Fair
95.6%
Brazilians
34.8
/100
|
#186
Fair
95.6%
Sudanese
33.0
/100
|
#187
Fair
95.6%
Liberians
32.4
/100
|
#188
Fair
95.6%
Immigrants | Micronesia
31.6
/100
|
#189
Fair
95.6%
Immigrants | Venezuela
30.8
/100
|
#190
Fair
95.6%
Immigrants | Nepal
30.2
/100
|
#191
Fair
95.6%
Pima
28.6
/100
|
#192
Fair
95.6%
Panamanians
28.4
/100
|
#193
Fair
95.6%
Guamanians/Chamorros
26.6
/100
|
#194
Fair
95.6%
Immigrants | Zaire
25.2
/100
|
#195
Fair
95.6%
Assyrians/Chaldeans/Syriacs
24.5
/100
|
#196
Fair
95.6%
Sierra Leoneans
24.3
/100
|
#197
Fair
95.6%
Paraguayans
22.6
/100
|
#198
Fair
95.5%