Ugandan vs South African 2nd Grade

COMPARE

Ugandan
Race
Ancestry
AfghanAfricanAlaska NativeAlaskan AthabascanAlbanianAleutAlsatianAmericanApacheArabArapahoArgentineanArmenianAssyrian/Chaldean/SyriacAustralianAustrianBahamianBangladeshiBarbadianBasqueBelgianBelizeanBermudanBhutaneseBlackfeetBolivianBrazilianBritishBritish West IndianBulgarianBurmeseCajunCambodianCanadianCape VerdeanCarpatho RusynCelticCentral AmericanCentral American IndianCherokeeCheyenneChickasawChileanChineseChippewaChoctawColombianColvilleComancheCosta RicanCreeCreekCroatianCrowCubanCypriotCzechCzechoslovakianDanishDelawareDominicanDutchDutch West IndianEastern EuropeanEcuadorianEgyptianEnglishEstonianEthiopianEuropeanFijianFilipinoFinnishFrenchFrench American IndianFrench CanadianGermanGerman RussianGhanaianGreekGuamanian/ChamorroGuatemalanGuyaneseHaitianHmongHonduranHopiHoumaHungarianIcelanderIndian (Asian)IndonesianInupiatIranianIraqiIrishIroquoisIsraeliItalianJamaicanJapaneseJordanianKenyanKiowaKoreanLaotianLatvianLebaneseLiberianLithuanianLumbeeLuxembourgerMacedonianMalaysianMalteseMarshalleseMenomineeMexicanMexican American IndianMongolianMoroccanNative HawaiianNavajoNepaleseNew ZealanderNicaraguanNigerianNorthern EuropeanNorwegianOkinawanOsageOttawaPaiutePakistaniPalestinianPanamanianParaguayanPennsylvania GermanPeruvianPimaPolishPortuguesePotawatomiPuebloPuerto RicanPuget Sound SalishRomanianRussianSalvadoranSamoanScandinavianScotch-IrishScottishSeminoleSenegaleseSerbianShoshoneSierra LeoneanSiouxSlavicSlovakSloveneSomaliSouth AmericanSouth American IndianSoviet UnionSpaniardSpanishSpanish AmericanSpanish American IndianSri LankanSubsaharan AfricanSudaneseSwedishSwissSyrianTaiwaneseThaiTlingit-HaidaTohono O'OdhamTonganTrinidadian and TobagonianTsimshianTurkishU.S. Virgin IslanderUgandanUkrainianUruguayanUteVenezuelanVietnameseWelshWest IndianYakamaYaquiYugoslavianYumanYup'ikZimbabwean
Immigration
NonimmigrantsImmigrantsAfghanistanAfricaAlbaniaArgentinaArmeniaAsiaAustraliaAustriaBahamasBangladeshBarbadosBelarusBelgiumBelizeBoliviaBosnia and HerzegovinaBrazilBulgariaBurma/MyanmarCabo VerdeCambodiaCameroonCanadaCaribbeanCentral AmericaChileChinaColombiaCongoCosta RicaCroatiaCubaCzechoslovakiaDenmarkDominicaDominican RepublicEastern AfricaEastern AsiaEastern EuropeEcuadorEgyptEl SalvadorEnglandEritreaEthiopiaEuropeFijiFranceGermanyGhanaGreeceGrenadaGuatemalaGuyanaHaitiHondurasHong KongHungaryIndiaIndonesiaIranIraqIrelandIsraelItalyJamaicaJapanJordanKazakhstanKenyaKoreaKuwaitLaosLatin AmericaLatviaLebanonLiberiaLithuaniaMalaysiaMexicoMicronesiaMiddle AfricaMoldovaMoroccoNepalNetherlandsNicaraguaNigeriaNorth AmericaNorth MacedoniaNorthern AfricaNorthern EuropeNorwayOceaniaPakistanPanamaPeruPhilippinesPolandPortugalRomaniaRussiaSaudi ArabiaScotlandSenegalSerbiaSierra LeoneSingaporeSomaliaSouth AfricaSouth AmericaSouth Central AsiaSouth Eastern AsiaSouthern EuropeSpainSri LankaSt. Vincent and the GrenadinesSudanSwedenSwitzerlandSyriaTaiwanThailandTrinidad and TobagoTurkeyUgandaUkraineUruguayUzbekistanVenezuelaVietnamWest IndiesWestern AfricaWestern AsiaWestern EuropeYemenZaireZimbabweAzores
South African
Race
Ancestry
AfghanAfricanAlaska NativeAlaskan AthabascanAlbanianAleutAlsatianAmericanApacheArabArapahoArgentineanArmenianAssyrian/Chaldean/SyriacAustralianAustrianBahamianBangladeshiBarbadianBasqueBelgianBelizeanBermudanBhutaneseBlackfeetBolivianBrazilianBritishBritish West IndianBulgarianBurmeseCajunCambodianCanadianCape VerdeanCarpatho RusynCelticCentral AmericanCentral American IndianCherokeeCheyenneChickasawChileanChineseChippewaChoctawColombianColvilleComancheCosta RicanCreeCreekCroatianCrowCubanCypriotCzechCzechoslovakianDanishDelawareDominicanDutchDutch West IndianEastern EuropeanEcuadorianEgyptianEnglishEstonianEthiopianEuropeanFijianFilipinoFinnishFrenchFrench American IndianFrench CanadianGermanGerman RussianGhanaianGreekGuamanian/ChamorroGuatemalanGuyaneseHaitianHmongHonduranHopiHoumaHungarianIcelanderIndian (Asian)IndonesianInupiatIranianIraqiIrishIroquoisIsraeliItalianJamaicanJapaneseJordanianKenyanKiowaKoreanLaotianLatvianLebaneseLiberianLithuanianLumbeeLuxembourgerMacedonianMalaysianMalteseMarshalleseMenomineeMexicanMexican American IndianMongolianMoroccanNative HawaiianNavajoNepaleseNew ZealanderNicaraguanNigerianNorthern EuropeanNorwegianOkinawanOsageOttawaPaiutePakistaniPalestinianPanamanianParaguayanPennsylvania GermanPeruvianPimaPolishPortuguesePotawatomiPuebloPuerto RicanPuget Sound SalishRomanianRussianSalvadoranSamoanScandinavianScotch-IrishScottishSeminoleSenegaleseSerbianShoshoneSierra LeoneanSiouxSlavicSlovakSloveneSomaliSouth AfricanSouth AmericanSouth American IndianSoviet UnionSpaniardSpanishSpanish AmericanSpanish American IndianSri LankanSubsaharan AfricanSudaneseSwedishSwissSyrianTaiwaneseThaiTlingit-HaidaTohono O'OdhamTonganTrinidadian and TobagonianTsimshianTurkishU.S. Virgin IslanderUkrainianUruguayanUteVenezuelanVietnameseWelshWest IndianYakamaYaquiYugoslavianYumanYup'ikZimbabwean
Immigration
NonimmigrantsImmigrantsAfghanistanAfricaAlbaniaArgentinaArmeniaAsiaAustraliaAustriaBahamasBangladeshBarbadosBelarusBelgiumBelizeBoliviaBosnia and HerzegovinaBrazilBulgariaBurma/MyanmarCabo VerdeCambodiaCameroonCanadaCaribbeanCentral AmericaChileChinaColombiaCongoCosta RicaCroatiaCubaCzechoslovakiaDenmarkDominicaDominican RepublicEastern AfricaEastern AsiaEastern EuropeEcuadorEgyptEl SalvadorEnglandEritreaEthiopiaEuropeFijiFranceGermanyGhanaGreeceGrenadaGuatemalaGuyanaHaitiHondurasHong KongHungaryIndiaIndonesiaIranIraqIrelandIsraelItalyJamaicaJapanJordanKazakhstanKenyaKoreaKuwaitLaosLatin AmericaLatviaLebanonLiberiaLithuaniaMalaysiaMexicoMicronesiaMiddle AfricaMoldovaMoroccoNepalNetherlandsNicaraguaNigeriaNorth AmericaNorth MacedoniaNorthern AfricaNorthern EuropeNorwayOceaniaPakistanPanamaPeruPhilippinesPolandPortugalRomaniaRussiaSaudi ArabiaScotlandSenegalSerbiaSierra LeoneSingaporeSomaliaSouth AfricaSouth AmericaSouth Central AsiaSouth Eastern AsiaSouthern EuropeSpainSri LankaSt. Vincent and the GrenadinesSudanSwedenSwitzerlandSyriaTaiwanThailandTrinidad and TobagoTurkeyUgandaUkraineUruguayUzbekistanVenezuelaVietnamWest IndiesWestern AfricaWestern AsiaWestern EuropeYemenZaireZimbabweAzores
2nd Grade
Income
Poverty
Unemployment
Labor Participation
Family Structure
Vehicle Availability
Education Level
Disability

2nd Grade Comparison

Ugandans

South Africans

Average
Exceptional
97.9%
2ND GRADE
56.6/ 100
METRIC RATING
164th/ 347
METRIC RANK
98.2%
2ND GRADE
98.6/ 100
METRIC RATING
95th/ 347
METRIC RANK

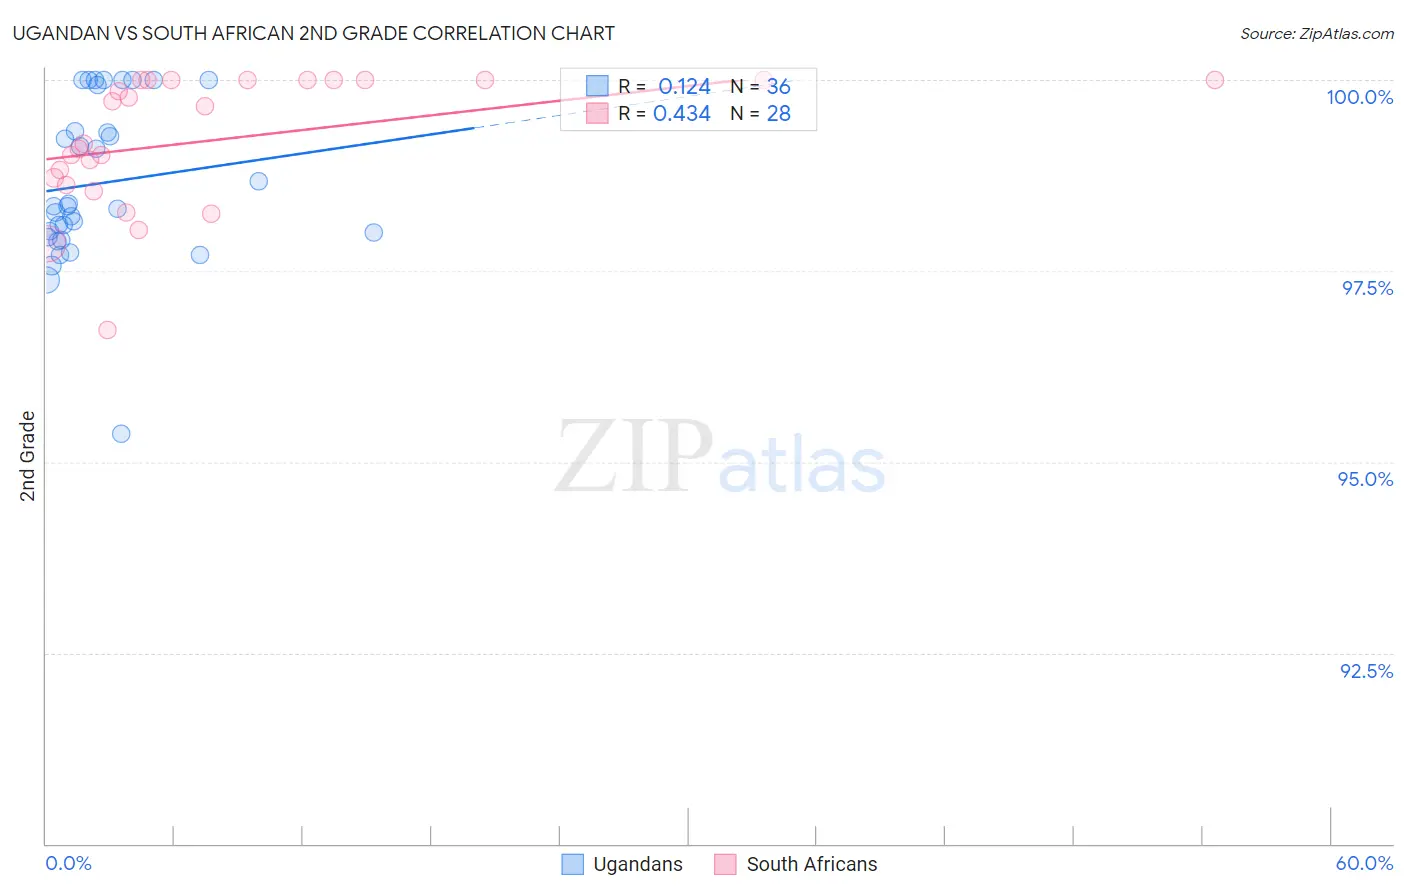
Ugandan vs South African 2nd Grade Correlation Chart

The statistical analysis conducted on geographies consisting of 93,991,892 people shows a poor positive correlation between the proportion of Ugandans and percentage of population with at least 2nd grade education in the United States with a correlation coefficient (R) of 0.124 and weighted average of 97.9%. Similarly, the statistical analysis conducted on geographies consisting of 182,602,894 people shows a moderate positive correlation between the proportion of South Africans and percentage of population with at least 2nd grade education in the United States with a correlation coefficient (R) of 0.434 and weighted average of 98.2%, a difference of 0.31%.
Ugandan vs South African 2nd Grade

2nd Grade Correlation Summary

MeasurementUgandanSouth African
Minimum95.4%96.7%
Maximum100.0%100.0%
Range4.6%3.3%
Mean98.7%99.2%
Median98.3%99.4%
Interquartile 25% (IQ1)98.0%98.7%
Interquartile 75% (IQ3)99.6%100.0%
Interquartile Range (IQR)1.7%1.3%
Standard Deviation (Sample)1.0%0.86%
Standard Deviation (Population)1.0%0.84%

Similar Demographics by 2nd Grade

Demographics Similar to Ugandans by 2nd Grade

In terms of 2nd grade, the demographic groups most similar to Ugandans are Spanish American (97.9%, a difference of 0.0%), Immigrants from Jordan (97.9%, a difference of 0.0%), Chilean (97.9%, a difference of 0.0%), Brazilian (97.9%, a difference of 0.0%), and Immigrants from Spain (97.9%, a difference of 0.0%).
DemographicsRating | Rank2nd Grade
Venezuelans
63.3
/100
|
#157
Good
97.9%
Immigrants | Iran
62.8
/100
|
#158
Good
97.9%
Comanche
62.8
/100
|
#159
Good
97.9%
Immigrants | Eastern Europe
61.1
/100
|
#160
Good
97.9%
Immigrants | Russia
60.3
/100
|
#161
Good
97.9%
Immigrants | Italy
60.2
/100
|
#162
Good
97.9%
Bermudans
59.4
/100
|
#163
Average
97.9%
Ugandans
56.6
/100
|
#164
Average
97.9%
Spanish Americans
56.4
/100
|
#165
Average
97.9%
Immigrants | Jordan
56.3
/100
|
#166
Average
97.9%
Chileans
56.1
/100
|
#167
Average
97.9%
Brazilians
55.8
/100
|
#168
Average
97.9%
Immigrants | Spain
55.4
/100
|
#169
Average
97.9%
Navajo
54.3
/100
|
#170
Average
97.9%
Albanians
52.8
/100
|
#171
Average
97.9%

Demographics Similar to South Africans by 2nd Grade

In terms of 2nd grade, the demographic groups most similar to South Africans are Immigrants from Germany (98.2%, a difference of 0.0%), Immigrants from India (98.2%, a difference of 0.010%), Cypriot (98.2%, a difference of 0.010%), Ukrainian (98.2%, a difference of 0.020%), and Zimbabwean (98.2%, a difference of 0.020%).
DemographicsRating | Rank2nd Grade
Macedonians
99.0
/100
|
#88
Exceptional
98.2%
Ukrainians
98.9
/100
|
#89
Exceptional
98.2%
Zimbabweans
98.8
/100
|
#90
Exceptional
98.2%
Immigrants | Western Europe
98.8
/100
|
#91
Exceptional
98.2%
Immigrants | South Africa
98.8
/100
|
#92
Exceptional
98.2%
Immigrants | India
98.8
/100
|
#93
Exceptional
98.2%
Immigrants | Germany
98.6
/100
|
#94
Exceptional
98.2%
South Africans
98.6
/100
|
#95
Exceptional
98.2%
Cypriots
98.4
/100
|
#96
Exceptional
98.2%
Choctaw
98.3
/100
|
#97
Exceptional
98.2%
Immigrants | Nonimmigrants
98.3
/100
|
#98
Exceptional
98.2%
Immigrants | Ireland
98.0
/100
|
#99
Exceptional
98.2%
Romanians
98.0
/100
|
#100
Exceptional
98.2%
Puget Sound Salish
98.0
/100
|
#101
Exceptional
98.2%
Cree
98.0
/100
|
#102
Exceptional
98.2%