Ugandan vs Immigrants from Hungary 10th Grade
COMPARE
Ugandan
Immigrants from Hungary
10th Grade
10th Grade Comparison
Ugandans
Immigrants from Hungary
94.0%
10TH GRADE
80.7/ 100
METRIC RATING
149th/ 347
METRIC RANK
94.4%
10TH GRADE
95.8/ 100
METRIC RATING
117th/ 347
METRIC RANK
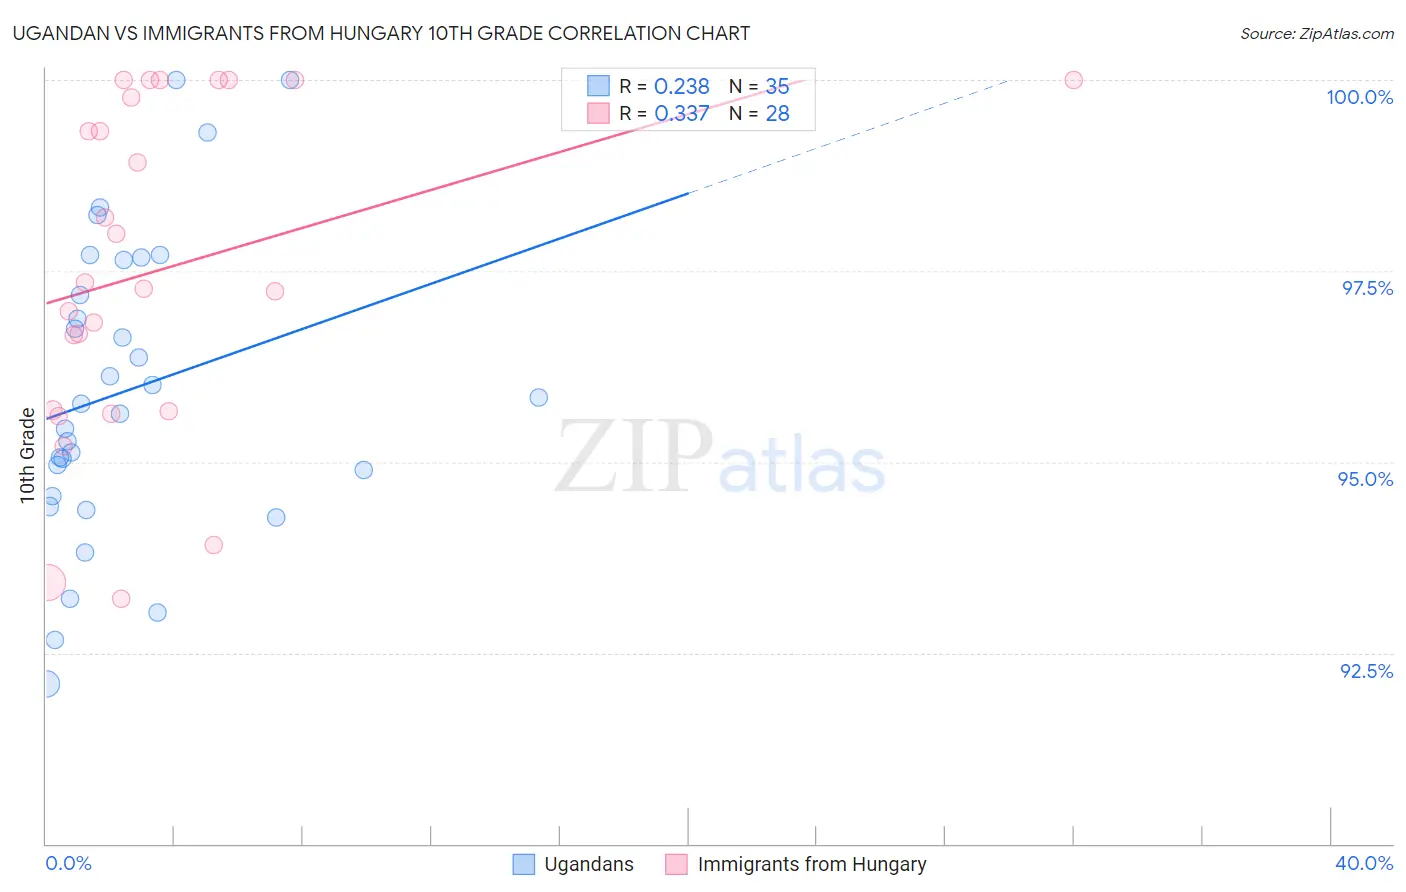
Ugandan vs Immigrants from Hungary 10th Grade Correlation Chart
The statistical analysis conducted on geographies consisting of 93,990,882 people shows a weak positive correlation between the proportion of Ugandans and percentage of population with at least 10th grade education in the United States with a correlation coefficient (R) of 0.238 and weighted average of 94.0%. Similarly, the statistical analysis conducted on geographies consisting of 195,707,305 people shows a mild positive correlation between the proportion of Immigrants from Hungary and percentage of population with at least 10th grade education in the United States with a correlation coefficient (R) of 0.337 and weighted average of 94.4%, a difference of 0.38%.
10th Grade Correlation Summary
| Measurement | Ugandan | Immigrants from Hungary |
| Minimum | 92.1% | 93.2% |
| Maximum | 100.0% | 100.0% |
| Range | 7.9% | 6.8% |
| Mean | 95.9% | 97.5% |
| Median | 95.8% | 97.3% |
| Interquartile 25% (IQ1) | 94.6% | 95.7% |
| Interquartile 75% (IQ3) | 97.6% | 99.9% |
| Interquartile Range (IQR) | 3.1% | 4.2% |
| Standard Deviation (Sample) | 2.0% | 2.2% |
| Standard Deviation (Population) | 1.9% | 2.1% |
Similar Demographics by 10th Grade
Demographics Similar to Ugandans by 10th Grade
In terms of 10th grade, the demographic groups most similar to Ugandans are Arab (94.0%, a difference of 0.0%), Immigrants from Ukraine (94.0%, a difference of 0.010%), Egyptian (94.0%, a difference of 0.020%), Kenyan (94.0%, a difference of 0.020%), and Chickasaw (94.1%, a difference of 0.030%).
| Demographics | Rating | Rank | 10th Grade |
| Albanians | 86.5 /100 | #142 | Excellent 94.1% |
| Cherokee | 84.9 /100 | #143 | Excellent 94.1% |
| Immigrants | Kazakhstan | 84.9 /100 | #144 | Excellent 94.1% |
| Immigrants | Nonimmigrants | 83.8 /100 | #145 | Excellent 94.1% |
| Chickasaw | 82.6 /100 | #146 | Excellent 94.1% |
| Immigrants | Ukraine | 81.5 /100 | #147 | Excellent 94.0% |
| Arabs | 80.9 /100 | #148 | Excellent 94.0% |
| Ugandans | 80.7 /100 | #149 | Excellent 94.0% |
| Egyptians | 79.6 /100 | #150 | Good 94.0% |
| Kenyans | 79.1 /100 | #151 | Good 94.0% |
| Immigrants | Italy | 78.0 /100 | #152 | Good 94.0% |
| Immigrants | Brazil | 75.5 /100 | #153 | Good 94.0% |
| Immigrants | Kenya | 75.3 /100 | #154 | Good 94.0% |
| Spanish | 74.9 /100 | #155 | Good 94.0% |
| Mongolians | 74.4 /100 | #156 | Good 94.0% |
Demographics Similar to Immigrants from Hungary by 10th Grade
In terms of 10th grade, the demographic groups most similar to Immigrants from Hungary are Jordanian (94.4%, a difference of 0.010%), Immigrants from Israel (94.4%, a difference of 0.020%), German Russian (94.4%, a difference of 0.030%), Delaware (94.4%, a difference of 0.030%), and Sioux (94.4%, a difference of 0.030%).
| Demographics | Rating | Rank | 10th Grade |
| Burmese | 97.1 /100 | #110 | Exceptional 94.5% |
| Immigrants | Zimbabwe | 96.8 /100 | #111 | Exceptional 94.4% |
| Immigrants | Kuwait | 96.8 /100 | #112 | Exceptional 94.4% |
| Palestinians | 96.5 /100 | #113 | Exceptional 94.4% |
| German Russians | 96.3 /100 | #114 | Exceptional 94.4% |
| Delaware | 96.3 /100 | #115 | Exceptional 94.4% |
| Sioux | 96.2 /100 | #116 | Exceptional 94.4% |
| Immigrants | Hungary | 95.8 /100 | #117 | Exceptional 94.4% |
| Jordanians | 95.6 /100 | #118 | Exceptional 94.4% |
| Immigrants | Israel | 95.4 /100 | #119 | Exceptional 94.4% |
| Immigrants | Taiwan | 95.3 /100 | #120 | Exceptional 94.4% |
| Immigrants | Belarus | 95.2 /100 | #121 | Exceptional 94.4% |
| Inupiat | 95.1 /100 | #122 | Exceptional 94.4% |
| Cree | 95.1 /100 | #123 | Exceptional 94.4% |
| Basques | 94.9 /100 | #124 | Exceptional 94.3% |