Ugandan vs Immigrants from Eritrea 9th Grade
COMPARE
Ugandan
Immigrants from Eritrea
9th Grade
9th Grade Comparison
Ugandans
Immigrants from Eritrea
95.1%
9TH GRADE
77.0/ 100
METRIC RATING
152nd/ 347
METRIC RANK
93.7%
9TH GRADE
0.1/ 100
METRIC RATING
278th/ 347
METRIC RANK
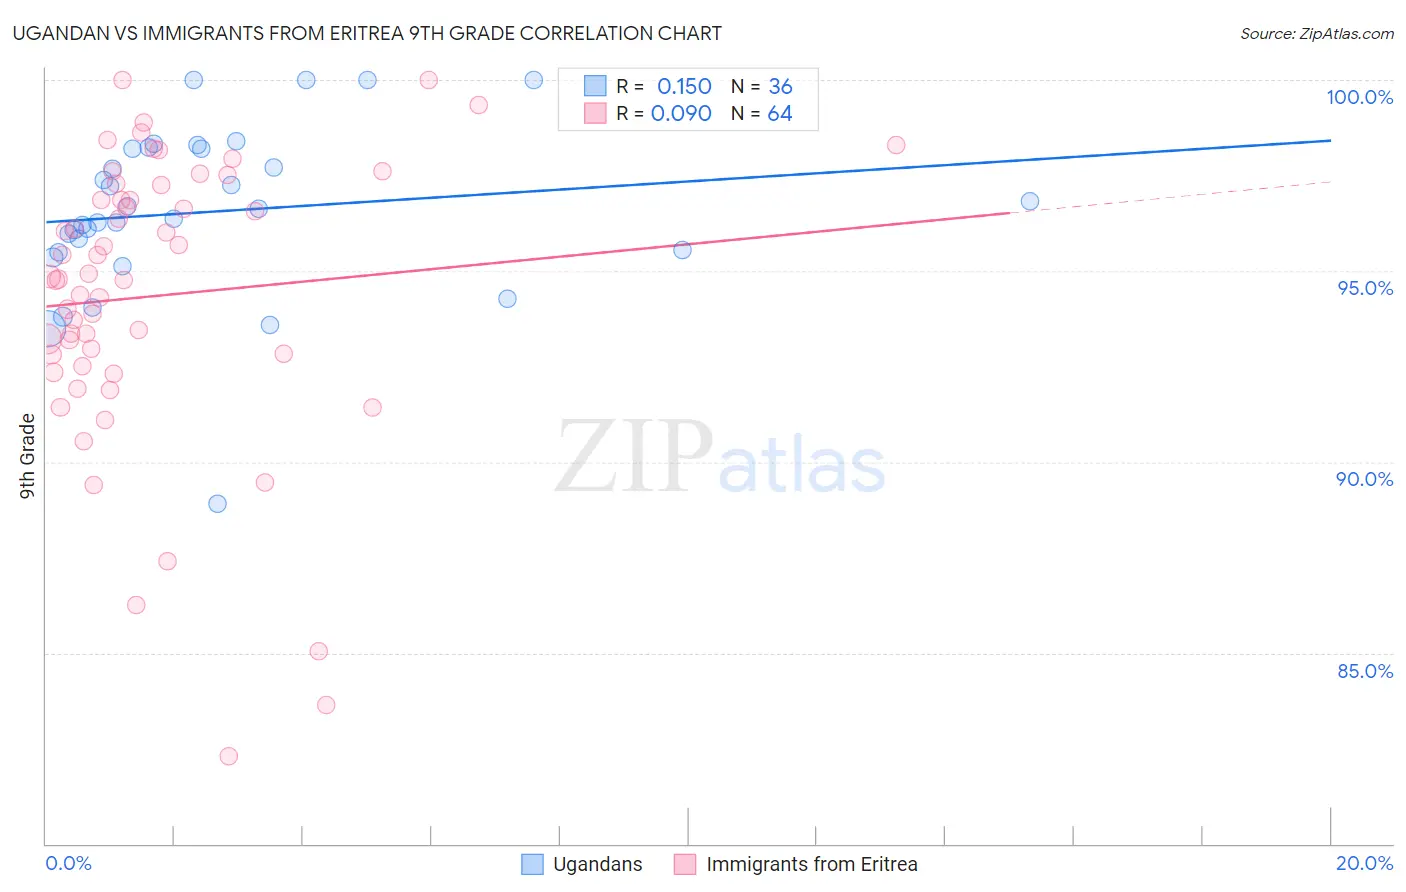
Ugandan vs Immigrants from Eritrea 9th Grade Correlation Chart
The statistical analysis conducted on geographies consisting of 93,991,892 people shows a poor positive correlation between the proportion of Ugandans and percentage of population with at least 9th grade education in the United States with a correlation coefficient (R) of 0.150 and weighted average of 95.1%. Similarly, the statistical analysis conducted on geographies consisting of 104,754,230 people shows a slight positive correlation between the proportion of Immigrants from Eritrea and percentage of population with at least 9th grade education in the United States with a correlation coefficient (R) of 0.090 and weighted average of 93.7%, a difference of 1.4%.
9th Grade Correlation Summary
| Measurement | Ugandan | Immigrants from Eritrea |
| Minimum | 88.9% | 82.3% |
| Maximum | 100.0% | 100.0% |
| Range | 11.1% | 17.7% |
| Mean | 96.6% | 94.3% |
| Median | 96.5% | 94.8% |
| Interquartile 25% (IQ1) | 95.5% | 92.7% |
| Interquartile 75% (IQ3) | 98.2% | 97.1% |
| Interquartile Range (IQR) | 2.7% | 4.4% |
| Standard Deviation (Sample) | 2.2% | 3.8% |
| Standard Deviation (Population) | 2.2% | 3.8% |
Similar Demographics by 9th Grade
Demographics Similar to Ugandans by 9th Grade
In terms of 9th grade, the demographic groups most similar to Ugandans are Cajun (95.1%, a difference of 0.0%), Albanian (95.1%, a difference of 0.010%), Kenyan (95.1%, a difference of 0.020%), Arab (95.1%, a difference of 0.020%), and Immigrants from Kazakhstan (95.1%, a difference of 0.020%).
| Demographics | Rating | Rank | 9th Grade |
| Pueblo | 82.2 /100 | #145 | Excellent 95.1% |
| Immigrants | Sri Lanka | 82.1 /100 | #146 | Excellent 95.1% |
| Choctaw | 81.9 /100 | #147 | Excellent 95.1% |
| Immigrants | Jordan | 81.2 /100 | #148 | Excellent 95.1% |
| Immigrants | Korea | 79.6 /100 | #149 | Good 95.1% |
| Kenyans | 79.1 /100 | #150 | Good 95.1% |
| Cajuns | 77.3 /100 | #151 | Good 95.1% |
| Ugandans | 77.0 /100 | #152 | Good 95.1% |
| Albanians | 76.1 /100 | #153 | Good 95.1% |
| Arabs | 74.9 /100 | #154 | Good 95.1% |
| Immigrants | Kazakhstan | 74.7 /100 | #155 | Good 95.1% |
| Immigrants | Kenya | 73.1 /100 | #156 | Good 95.0% |
| Mongolians | 73.0 /100 | #157 | Good 95.0% |
| Egyptians | 70.1 /100 | #158 | Good 95.0% |
| Immigrants | Ukraine | 67.4 /100 | #159 | Good 95.0% |
Demographics Similar to Immigrants from Eritrea by 9th Grade
In terms of 9th grade, the demographic groups most similar to Immigrants from Eritrea are Immigrants from Philippines (93.7%, a difference of 0.0%), West Indian (93.7%, a difference of 0.010%), Immigrants from Colombia (93.8%, a difference of 0.030%), Immigrants from South America (93.8%, a difference of 0.040%), and Peruvian (93.8%, a difference of 0.040%).
| Demographics | Rating | Rank | 9th Grade |
| Immigrants | Ghana | 0.2 /100 | #271 | Tragic 93.8% |
| Immigrants | Western Africa | 0.2 /100 | #272 | Tragic 93.8% |
| Immigrants | South America | 0.2 /100 | #273 | Tragic 93.8% |
| Peruvians | 0.2 /100 | #274 | Tragic 93.8% |
| Immigrants | Colombia | 0.2 /100 | #275 | Tragic 93.8% |
| West Indians | 0.2 /100 | #276 | Tragic 93.7% |
| Immigrants | Philippines | 0.1 /100 | #277 | Tragic 93.7% |
| Immigrants | Eritrea | 0.1 /100 | #278 | Tragic 93.7% |
| Trinidadians and Tobagonians | 0.1 /100 | #279 | Tragic 93.7% |
| Taiwanese | 0.1 /100 | #280 | Tragic 93.6% |
| Immigrants | Trinidad and Tobago | 0.1 /100 | #281 | Tragic 93.6% |
| Malaysians | 0.0 /100 | #282 | Tragic 93.5% |
| Barbadians | 0.0 /100 | #283 | Tragic 93.5% |
| Bangladeshis | 0.0 /100 | #284 | Tragic 93.4% |
| Immigrants | Peru | 0.0 /100 | #285 | Tragic 93.4% |