Turkish vs Yugoslavian Master's Degree

COMPARE

Turkish
Race
Ancestry
AfghanAfricanAlaska NativeAlaskan AthabascanAlbanianAleutAlsatianAmericanApacheArabArapahoArgentineanArmenianAssyrian/Chaldean/SyriacAustralianAustrianBahamianBangladeshiBarbadianBasqueBelgianBelizeanBermudanBhutaneseBlackfeetBolivianBrazilianBritishBritish West IndianBulgarianBurmeseCajunCambodianCanadianCape VerdeanCarpatho RusynCelticCentral AmericanCentral American IndianCherokeeCheyenneChickasawChileanChineseChippewaChoctawColombianColvilleComancheCosta RicanCreeCreekCroatianCrowCubanCypriotCzechCzechoslovakianDanishDelawareDominicanDutchDutch West IndianEastern EuropeanEcuadorianEgyptianEnglishEstonianEthiopianEuropeanFijianFilipinoFinnishFrenchFrench American IndianFrench CanadianGermanGerman RussianGhanaianGreekGuamanian/ChamorroGuatemalanGuyaneseHaitianHmongHonduranHopiHoumaHungarianIcelanderIndian (Asian)IndonesianInupiatIranianIraqiIrishIroquoisIsraeliItalianJamaicanJapaneseJordanianKenyanKiowaKoreanLaotianLatvianLebaneseLiberianLithuanianLumbeeLuxembourgerMacedonianMalaysianMalteseMarshalleseMenomineeMexicanMexican American IndianMongolianMoroccanNative HawaiianNavajoNepaleseNew ZealanderNicaraguanNigerianNorthern EuropeanNorwegianOkinawanOsageOttawaPaiutePakistaniPalestinianPanamanianParaguayanPennsylvania GermanPeruvianPimaPolishPortuguesePotawatomiPuebloPuerto RicanPuget Sound SalishRomanianRussianSalvadoranSamoanScandinavianScotch-IrishScottishSeminoleSenegaleseSerbianShoshoneSierra LeoneanSiouxSlavicSlovakSloveneSomaliSouth AfricanSouth AmericanSouth American IndianSoviet UnionSpaniardSpanishSpanish AmericanSpanish American IndianSri LankanSubsaharan AfricanSudaneseSwedishSwissSyrianTaiwaneseThaiTlingit-HaidaTohono O'OdhamTonganTrinidadian and TobagonianTsimshianTurkishU.S. Virgin IslanderUgandanUkrainianUruguayanUteVenezuelanVietnameseWelshWest IndianYakamaYaquiYumanYup'ikZimbabwean
Immigration
NonimmigrantsImmigrantsAfghanistanAfricaAlbaniaArgentinaArmeniaAsiaAustraliaAustriaBahamasBangladeshBarbadosBelarusBelgiumBelizeBoliviaBosnia and HerzegovinaBrazilBulgariaBurma/MyanmarCabo VerdeCambodiaCameroonCanadaCaribbeanCentral AmericaChileChinaColombiaCongoCosta RicaCroatiaCubaCzechoslovakiaDenmarkDominicaDominican RepublicEastern AfricaEastern AsiaEastern EuropeEcuadorEgyptEl SalvadorEnglandEritreaEthiopiaEuropeFijiFranceGermanyGhanaGreeceGrenadaGuatemalaGuyanaHaitiHondurasHong KongHungaryIndiaIndonesiaIranIraqIrelandIsraelItalyJamaicaJapanJordanKazakhstanKenyaKoreaKuwaitLaosLatin AmericaLatviaLebanonLiberiaLithuaniaMalaysiaMexicoMicronesiaMiddle AfricaMoldovaMoroccoNepalNetherlandsNicaraguaNigeriaNorth AmericaNorth MacedoniaNorthern AfricaNorthern EuropeNorwayOceaniaPakistanPanamaPeruPhilippinesPolandPortugalRomaniaRussiaSaudi ArabiaScotlandSenegalSerbiaSierra LeoneSingaporeSomaliaSouth AfricaSouth AmericaSouth Central AsiaSouth Eastern AsiaSouthern EuropeSpainSri LankaSt. Vincent and the GrenadinesSudanSwedenSwitzerlandSyriaTaiwanThailandTrinidad and TobagoTurkeyUgandaUkraineUruguayUzbekistanVenezuelaVietnamWest IndiesWestern AfricaWestern AsiaWestern EuropeYemenZaireZimbabweAzores
Yugoslavian
Race
Ancestry
AfghanAfricanAlaska NativeAlaskan AthabascanAlbanianAleutAlsatianAmericanApacheArabArapahoArgentineanArmenianAssyrian/Chaldean/SyriacAustralianAustrianBahamianBangladeshiBarbadianBasqueBelgianBelizeanBermudanBhutaneseBlackfeetBolivianBrazilianBritishBritish West IndianBulgarianBurmeseCajunCambodianCanadianCape VerdeanCarpatho RusynCelticCentral AmericanCentral American IndianCherokeeCheyenneChickasawChileanChineseChippewaChoctawColombianColvilleComancheCosta RicanCreeCreekCroatianCrowCubanCypriotCzechCzechoslovakianDanishDelawareDominicanDutchDutch West IndianEastern EuropeanEcuadorianEgyptianEnglishEstonianEthiopianEuropeanFijianFilipinoFinnishFrenchFrench American IndianFrench CanadianGermanGerman RussianGhanaianGreekGuamanian/ChamorroGuatemalanGuyaneseHaitianHmongHonduranHopiHoumaHungarianIcelanderIndian (Asian)IndonesianInupiatIranianIraqiIrishIroquoisIsraeliItalianJamaicanJapaneseJordanianKenyanKiowaKoreanLaotianLatvianLebaneseLiberianLithuanianLumbeeLuxembourgerMacedonianMalaysianMalteseMarshalleseMenomineeMexicanMexican American IndianMongolianMoroccanNative HawaiianNavajoNepaleseNew ZealanderNicaraguanNigerianNorthern EuropeanNorwegianOkinawanOsageOttawaPaiutePakistaniPalestinianPanamanianParaguayanPennsylvania GermanPeruvianPimaPolishPortuguesePotawatomiPuebloPuerto RicanPuget Sound SalishRomanianRussianSalvadoranSamoanScandinavianScotch-IrishScottishSeminoleSenegaleseSerbianShoshoneSierra LeoneanSiouxSlavicSlovakSloveneSomaliSouth AfricanSouth AmericanSouth American IndianSoviet UnionSpaniardSpanishSpanish AmericanSpanish American IndianSri LankanSubsaharan AfricanSudaneseSwedishSwissSyrianTaiwaneseThaiTlingit-HaidaTohono O'OdhamTonganTrinidadian and TobagonianTsimshianU.S. Virgin IslanderUgandanUkrainianUruguayanUteVenezuelanVietnameseWelshWest IndianYakamaYaquiYugoslavianYumanYup'ikZimbabwean
Immigration
NonimmigrantsImmigrantsAfghanistanAfricaAlbaniaArgentinaArmeniaAsiaAustraliaAustriaBahamasBangladeshBarbadosBelarusBelgiumBelizeBoliviaBosnia and HerzegovinaBrazilBulgariaBurma/MyanmarCabo VerdeCambodiaCameroonCanadaCaribbeanCentral AmericaChileChinaColombiaCongoCosta RicaCroatiaCubaCzechoslovakiaDenmarkDominicaDominican RepublicEastern AfricaEastern AsiaEastern EuropeEcuadorEgyptEl SalvadorEnglandEritreaEthiopiaEuropeFijiFranceGermanyGhanaGreeceGrenadaGuatemalaGuyanaHaitiHondurasHong KongHungaryIndiaIndonesiaIranIraqIrelandIsraelItalyJamaicaJapanJordanKazakhstanKenyaKoreaKuwaitLaosLatin AmericaLatviaLebanonLiberiaLithuaniaMalaysiaMexicoMicronesiaMiddle AfricaMoldovaMoroccoNepalNetherlandsNicaraguaNigeriaNorth AmericaNorth MacedoniaNorthern AfricaNorthern EuropeNorwayOceaniaPakistanPanamaPeruPhilippinesPolandPortugalRomaniaRussiaSaudi ArabiaScotlandSenegalSerbiaSierra LeoneSingaporeSomaliaSouth AfricaSouth AmericaSouth Central AsiaSouth Eastern AsiaSouthern EuropeSpainSri LankaSt. Vincent and the GrenadinesSudanSwedenSwitzerlandSyriaTaiwanThailandTrinidad and TobagoTurkeyUgandaUkraineUruguayUzbekistanVenezuelaVietnamWest IndiesWestern AfricaWestern AsiaWestern EuropeYemenZaireZimbabweAzores
Master's Degree
Income
Poverty
Unemployment
Labor Participation
Family Structure
Vehicle Availability
Education Level
Disability

Master's Degree Comparison

Turks

Yugoslavians

Exceptional
Fair
19.9%
MASTER'S DEGREE
100.0/ 100
METRIC RATING
28th/ 347
METRIC RANK
14.4%
MASTER'S DEGREE
24.3/ 100
METRIC RATING
203rd/ 347
METRIC RANK

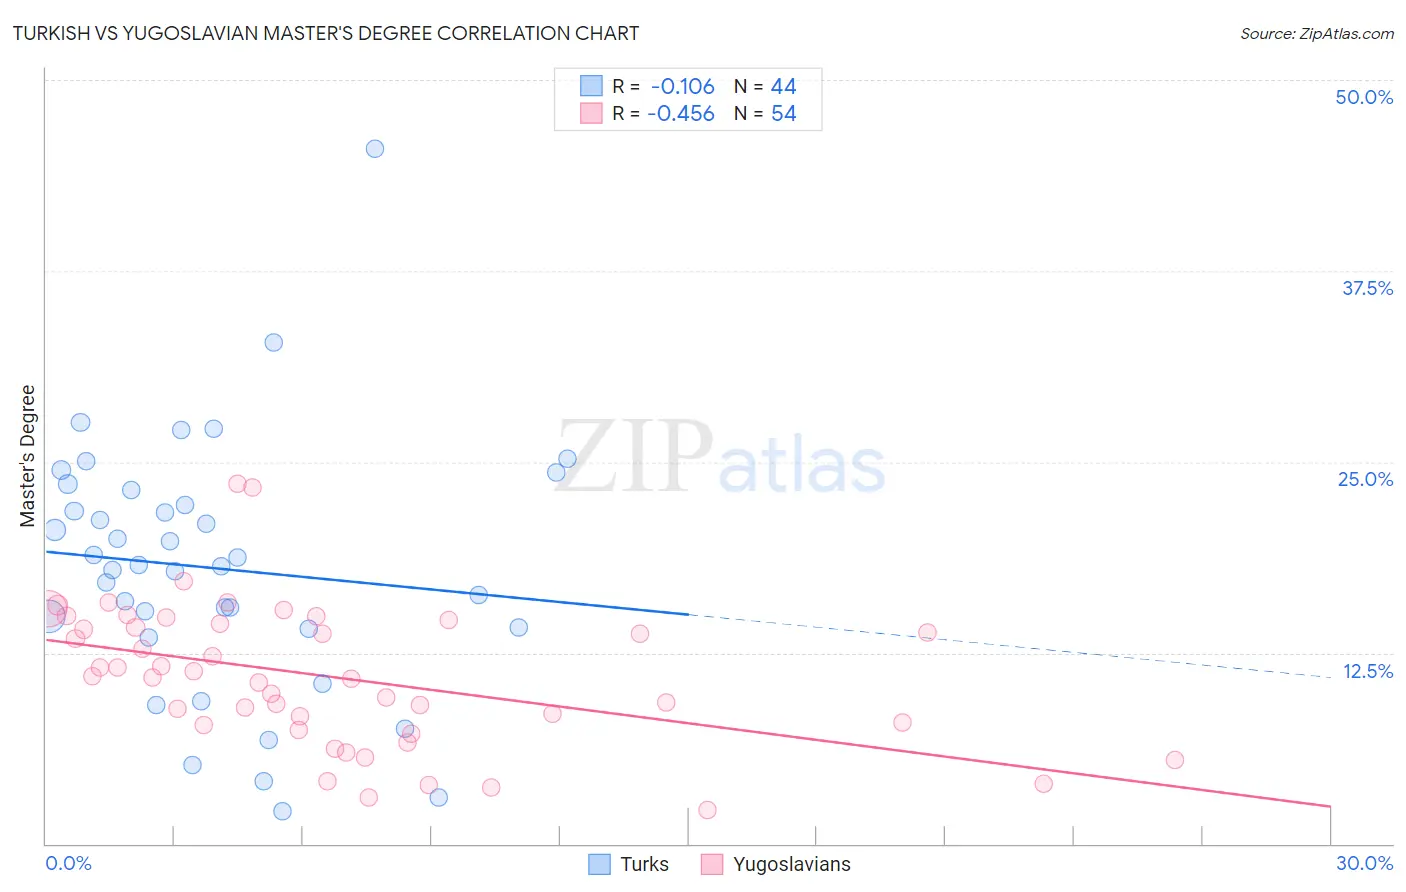
Turkish vs Yugoslavian Master's Degree Correlation Chart

The statistical analysis conducted on geographies consisting of 271,799,708 people shows a poor negative correlation between the proportion of Turks and percentage of population with at least master's degree education in the United States with a correlation coefficient (R) of -0.106 and weighted average of 19.9%. Similarly, the statistical analysis conducted on geographies consisting of 285,661,106 people shows a moderate negative correlation between the proportion of Yugoslavians and percentage of population with at least master's degree education in the United States with a correlation coefficient (R) of -0.456 and weighted average of 14.4%, a difference of 38.4%.
Turkish vs Yugoslavian Master's Degree

Master's Degree Correlation Summary

MeasurementTurkishYugoslavian
Minimum2.1%2.2%
Maximum45.5%23.6%
Range43.4%21.4%
Mean18.0%10.9%
Median18.2%10.9%
Interquartile 25% (IQ1)14.1%7.8%
Interquartile 75% (IQ3)22.6%14.4%
Interquartile Range (IQR)8.6%6.6%
Standard Deviation (Sample)8.2%4.7%
Standard Deviation (Population)8.2%4.6%

Similar Demographics by Master's Degree

Demographics Similar to Turks by Master's Degree

In terms of master's degree, the demographic groups most similar to Turks are Immigrants from Sri Lanka (19.9%, a difference of 0.070%), Latvian (19.8%, a difference of 0.41%), Cambodian (20.0%, a difference of 0.48%), Immigrants from Japan (20.0%, a difference of 0.58%), and Immigrants from Turkey (19.7%, a difference of 0.92%).
DemographicsRating | RankMaster's Degree
Immigrants | Ireland
100.0
/100
|
#21
Exceptional
20.4%
Israelis
100.0
/100
|
#22
Exceptional
20.3%
Immigrants | France
100.0
/100
|
#23
Exceptional
20.3%
Immigrants | Sweden
100.0
/100
|
#24
Exceptional
20.3%
Immigrants | Japan
100.0
/100
|
#25
Exceptional
20.0%
Cambodians
100.0
/100
|
#26
Exceptional
20.0%
Immigrants | Sri Lanka
100.0
/100
|
#27
Exceptional
19.9%
Turks
100.0
/100
|
#28
Exceptional
19.9%
Latvians
100.0
/100
|
#29
Exceptional
19.8%
Immigrants | Turkey
100.0
/100
|
#30
Exceptional
19.7%
Immigrants | Korea
100.0
/100
|
#31
Exceptional
19.7%
Burmese
100.0
/100
|
#32
Exceptional
19.7%
Russians
100.0
/100
|
#33
Exceptional
19.5%
Immigrants | Denmark
100.0
/100
|
#34
Exceptional
19.5%
Immigrants | Northern Europe
100.0
/100
|
#35
Exceptional
19.5%

Demographics Similar to Yugoslavians by Master's Degree

In terms of master's degree, the demographic groups most similar to Yugoslavians are Immigrants from Western Africa (14.4%, a difference of 0.11%), French (14.4%, a difference of 0.11%), Panamanian (14.4%, a difference of 0.13%), Scotch-Irish (14.4%, a difference of 0.13%), and Trinidadian and Tobagonian (14.4%, a difference of 0.15%).
DemographicsRating | RankMaster's Degree
Czechoslovakians
29.9
/100
|
#196
Fair
14.5%
Belgians
28.0
/100
|
#197
Fair
14.5%
West Indians
27.4
/100
|
#198
Fair
14.5%
Immigrants | Armenia
27.2
/100
|
#199
Fair
14.5%
Panamanians
25.1
/100
|
#200
Fair
14.4%
Scotch-Irish
25.0
/100
|
#201
Fair
14.4%
Immigrants | Western Africa
24.9
/100
|
#202
Fair
14.4%
Yugoslavians
24.3
/100
|
#203
Fair
14.4%
French
23.7
/100
|
#204
Fair
14.4%
Trinidadians and Tobagonians
23.5
/100
|
#205
Fair
14.4%
Scandinavians
23.3
/100
|
#206
Fair
14.4%
Immigrants | Bosnia and Herzegovina
22.0
/100
|
#207
Fair
14.3%
Immigrants | Barbados
20.5
/100
|
#208
Fair
14.3%
Immigrants | Panama
20.0
/100
|
#209
Fair
14.3%
Sub-Saharan Africans
19.4
/100
|
#210
Poor
14.2%