Turkish vs Immigrants from Nepal Associate's Degree
COMPARE
Turkish
Immigrants from Nepal
Associate's Degree
Associate's Degree Comparison
Turks
Immigrants from Nepal
53.9%
ASSOCIATE'S DEGREE
100.0/ 100
METRIC RATING
28th/ 347
METRIC RANK
49.5%
ASSOCIATE'S DEGREE
97.5/ 100
METRIC RATING
100th/ 347
METRIC RANK
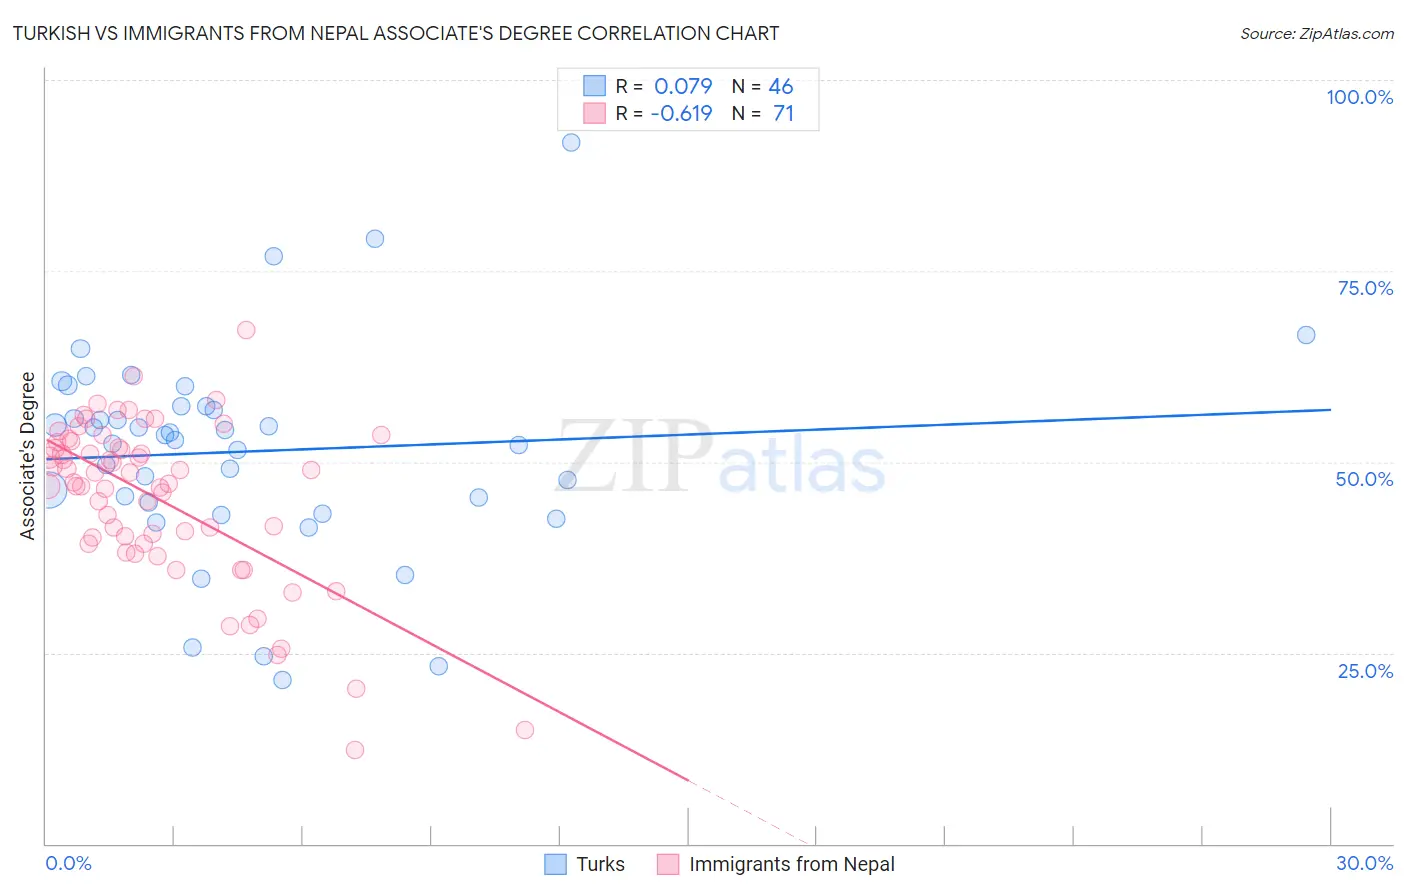
Turkish vs Immigrants from Nepal Associate's Degree Correlation Chart
The statistical analysis conducted on geographies consisting of 271,852,708 people shows a slight positive correlation between the proportion of Turks and percentage of population with at least associate's degree education in the United States with a correlation coefficient (R) of 0.079 and weighted average of 53.9%. Similarly, the statistical analysis conducted on geographies consisting of 186,769,874 people shows a significant negative correlation between the proportion of Immigrants from Nepal and percentage of population with at least associate's degree education in the United States with a correlation coefficient (R) of -0.619 and weighted average of 49.5%, a difference of 8.8%.
Associate's Degree Correlation Summary
| Measurement | Turkish | Immigrants from Nepal |
| Minimum | 21.5% | 12.3% |
| Maximum | 91.9% | 67.3% |
| Range | 70.3% | 55.0% |
| Mean | 51.4% | 45.2% |
| Median | 53.2% | 47.3% |
| Interquartile 25% (IQ1) | 44.6% | 39.2% |
| Interquartile 75% (IQ3) | 57.2% | 52.6% |
| Interquartile Range (IQR) | 12.6% | 13.3% |
| Standard Deviation (Sample) | 13.6% | 10.7% |
| Standard Deviation (Population) | 13.4% | 10.6% |
Similar Demographics by Associate's Degree
Demographics Similar to Turks by Associate's Degree
In terms of associate's degree, the demographic groups most similar to Turks are Immigrants from France (53.9%, a difference of 0.010%), Latvian (53.9%, a difference of 0.070%), Immigrants from Sri Lanka (53.7%, a difference of 0.43%), Immigrants from Northern Europe (53.5%, a difference of 0.79%), and Immigrants from Turkey (53.4%, a difference of 0.82%).
| Demographics | Rating | Rank | Associate's Degree |
| Immigrants | Sweden | 100.0 /100 | #21 | Exceptional 54.6% |
| Immigrants | Japan | 100.0 /100 | #22 | Exceptional 54.6% |
| Burmese | 100.0 /100 | #23 | Exceptional 54.6% |
| Immigrants | Korea | 100.0 /100 | #24 | Exceptional 54.5% |
| Immigrants | Switzerland | 100.0 /100 | #25 | Exceptional 54.5% |
| Immigrants | Belgium | 100.0 /100 | #26 | Exceptional 54.5% |
| Latvians | 100.0 /100 | #27 | Exceptional 53.9% |
| Turks | 100.0 /100 | #28 | Exceptional 53.9% |
| Immigrants | France | 100.0 /100 | #29 | Exceptional 53.9% |
| Immigrants | Sri Lanka | 100.0 /100 | #30 | Exceptional 53.7% |
| Immigrants | Northern Europe | 100.0 /100 | #31 | Exceptional 53.5% |
| Immigrants | Turkey | 100.0 /100 | #32 | Exceptional 53.4% |
| Israelis | 100.0 /100 | #33 | Exceptional 53.4% |
| Bulgarians | 100.0 /100 | #34 | Exceptional 53.3% |
| Russians | 100.0 /100 | #35 | Exceptional 53.2% |
Demographics Similar to Immigrants from Nepal by Associate's Degree
In terms of associate's degree, the demographic groups most similar to Immigrants from Nepal are Northern European (49.5%, a difference of 0.16%), Chilean (49.4%, a difference of 0.19%), Macedonian (49.6%, a difference of 0.22%), Immigrants from Northern Africa (49.7%, a difference of 0.28%), and Ukrainian (49.4%, a difference of 0.29%).
| Demographics | Rating | Rank | Associate's Degree |
| Immigrants | Brazil | 98.5 /100 | #93 | Exceptional 50.0% |
| Laotians | 98.4 /100 | #94 | Exceptional 49.9% |
| Immigrants | England | 98.0 /100 | #95 | Exceptional 49.7% |
| Romanians | 98.0 /100 | #96 | Exceptional 49.7% |
| Immigrants | Ukraine | 98.0 /100 | #97 | Exceptional 49.7% |
| Immigrants | Northern Africa | 97.9 /100 | #98 | Exceptional 49.7% |
| Macedonians | 97.8 /100 | #99 | Exceptional 49.6% |
| Immigrants | Nepal | 97.5 /100 | #100 | Exceptional 49.5% |
| Northern Europeans | 97.3 /100 | #101 | Exceptional 49.5% |
| Chileans | 97.3 /100 | #102 | Exceptional 49.4% |
| Ukrainians | 97.1 /100 | #103 | Exceptional 49.4% |
| Venezuelans | 97.0 /100 | #104 | Exceptional 49.4% |
| Croatians | 96.8 /100 | #105 | Exceptional 49.3% |
| Immigrants | Italy | 96.7 /100 | #106 | Exceptional 49.3% |
| Syrians | 96.7 /100 | #107 | Exceptional 49.3% |